参加するコンペ
Google Analytics Customer Revenue Prediction
https://www.kaggle.com/c/google-analytics-customer-revenue-prediction
はじめに何をしたか
データをlocalに落とし、以下フォルダを作成
input, output
データをjupyter notebookで見てみる
https://www.kaggle.com/dimitreoliveira/deep-learning-keras-revenue-pred-in-progress
を参考にし冒頭のデータ読み込み部分を実行
ライブラリの読み込み
import os
import json
import numpy as np
import pandas as pd
import matplotlib.pyplot as plt
from pandas.io.json import json_normalize
from sklearn import preprocessing
from sklearn.model_selection import train_test_split
from keras.models import Sequential
from keras.layers import Dense
from keras import optimizers

%matplotlib inline
pd.options.display.max_columns = 999
データを読み込むための関数を作成
def load_df(csv_path='../input/train.csv', nrows=None):
    JSON_COLUMNS = ['device', 'geoNetwork', 'totals', 'trafficSource']

    df = pd.read_csv(csv_path, dtype={'fullVisitorId': 'str'}, nrows=nrows)

    for column in JSON_COLUMNS:
        df = df.join(pd.DataFrame(df.pop(column).apply(pd.io.json.loads).values.tolist(), index=df.index))

    return df
学習データの読み込み
%%time
train = load_df("input/train.csv")
この際にErrorが発生したため, train.csv, test.csv, samplesubmission.csv に対して以下を実行
chmod 755 *
テストデータの読み込み
%%time
test = load_df("../input/test.csv")
日付を日付型に変更
def add_time_features(df):
    df['date'] = pd.to_datetime(df['date'], format='%Y%m%d', errors='ignore')
    df['year'] = df['date'].apply(lambda x: x.year)
    df['month'] = df['date'].apply(lambda x: x.month)
    df['day'] = df['date'].apply(lambda x: x.day)
    df['weekday'] = df['date'].apply(lambda x: x.weekday())

    return df

train = add_time_features(train)
test = add_time_features(test)
transactionRevenue を見るためにfloat型に変換
train["transactionRevenue"] = train["transactionRevenue"].astype('float')
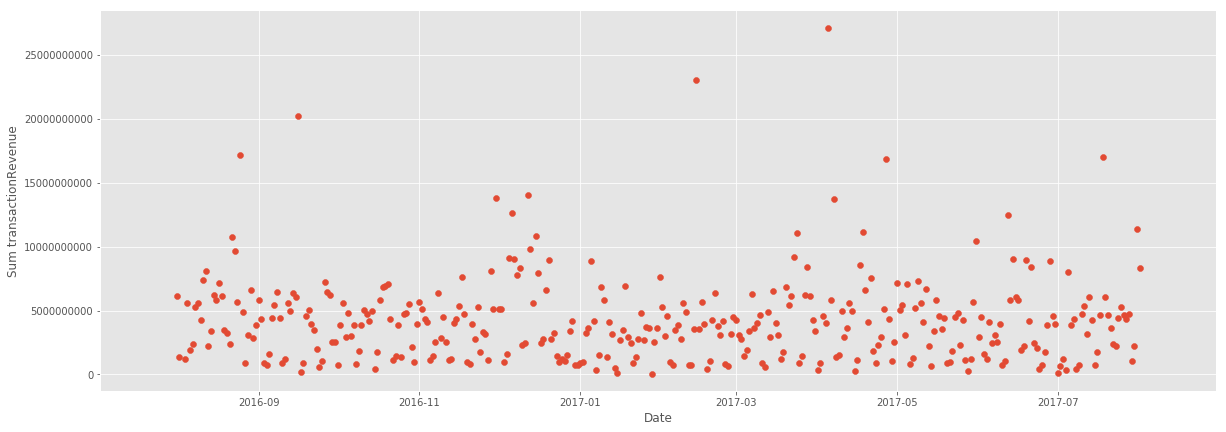
時間で目標の値がどう変化しているかを確認
time_agg = train.groupby('date')['transactionRevenue'].agg(['count', 'sum'])
year_agg = train.groupby('year')['transactionRevenue'].agg(['sum'])
month_agg = train.groupby('month')['transactionRevenue'].agg(['sum'])
day_agg = train.groupby('day')['transactionRevenue'].agg(['sum'])
weekday_agg = train.groupby('weekday')['transactionRevenue'].agg(['count','sum'])
年ごと、月ごと、日ごと、曜日ごとに見てみる
fig, ((ax1, ax2), (ax3, ax4)) = plt.subplots(nrows=2, ncols=2, figsize=(20,7))
ax1.scatter(year_agg.index.values, year_agg['sum'])
ax1.locator_params(nbins=2)
ax1.ticklabel_format(axis='y', style='plain')
ax1.set_xlabel('Year', fontsize=12)

ax2.scatter(month_agg.index.values, month_agg['sum'])
ax2.locator_params(nbins=12)
ax2.ticklabel_format(axis='y', style='plain')
ax2.set_xlabel('Month', fontsize=12)

ax3.scatter(day_agg.index.values, day_agg['sum'])
ax3.locator_params(nbins=10)
ax3.ticklabel_format(axis='y', style='plain')
ax3.set_xlabel('Day', fontsize=12)

ax4.scatter(weekday_agg.index.values, weekday_agg['sum'])
ax4.locator_params(nbins=7)
ax4.ticklabel_format(axis='y', style='plain')
ax4.set_xlabel('Weekday', fontsize=12)

plt.tight_layout()
plt.show()
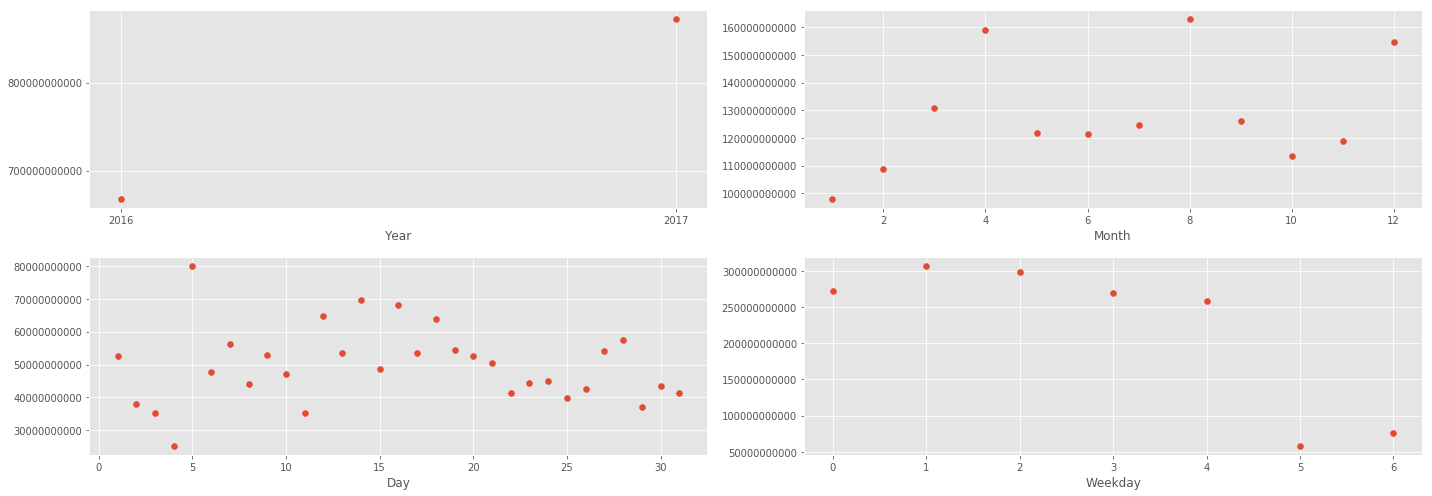
分析から
- Year : 2016年から2017年にかけて、増加した
- Month : 12月が増大するのはわかるが、4月と8月になぜ増加しているのか
- Day : 重要でないことが起きている可能性がある
- Weekday : 週末の取引が少ない
コードを綺麗にする
辞書型列を削除
train = train.drop(['adwordsClickInfo'], axis=1)
test = test.drop(['adwordsClickInfo'], axis=1)
学習データのみ存在する列を削除
train = train.drop(['campaignCode'], axis=1)
transactionRevenueのNaNを0に置き換え
train["transactionRevenue"].fillna(0, inplace=True)
テストデータのidを取得
test_ids = test["fullVisitorId"].values
必要のない列を削除
unwanted_columns = ['fullVisitorId', 'sessionId', 'visitId', 'visitStartTime',
                    'browser', 'browserSize', 'browserVersion', 'flashVersion',
                    'mobileDeviceInfo', 'mobileDeviceMarketingName', 'mobileDeviceModel',
                    'mobileInputSelector', 'operatingSystemVersion', 'screenColors',
                    'metro','networkDomain', 'networkLocation', 'adContent', 'campaign',
                    'isTrueDirect', 'keyword', 'referralPath', 'source', 'operatingSystem',
                    'date', 'day']

train = train.drop(unwanted_columns, axis=1)
test = test.drop(unwanted_columns, axis=1)
全て同じ値の列を削除
constant_columns = [col for col in train.columns if train[col].nunique()<=1]
print('Columns with constant values: ', constant_columns)
train = train.drop(constant_columns, axis=1)
test = test.drop(constant_columns, axis=1)
半分以上がnullのデータ列を削除
high_null_columns = [c for c in train.columns if train[c].count()<=len(train) * 0.5]
print('Columns more than 50% null values: ', high_null_columns)
train = train.drop(high_null_columns, axis=1)
test = test.drop(high_null_columns, axis=1)
特徴量を削減するために該当列を削除
reduce_features = ['city', 'year', 'medium', 'channelGrouping',
                    'region', 'subContinent', 'country']
train = train.drop(reduce_features, axis=1)
test = test.drop(reduce_features, axis=1)
データを確認
print('TRAIN SET')
print('Rows: %s' % train.shape[0])
print('Columns: %s' % train.shape[1])
print('Features: %s' % train.columns.values)
print()
print('TEST SET')
print('Rows: %s' % test.shape[0])
print('Columns: %s' % test.shape[1])
print('Features: %s' % test.columns.values)
カテゴリデータをOne-hot encoding
categorical_features = ['deviceCategory', 'isMobile', 'continent', 'month', 'weekday']
train = pd.get_dummies(train, columns=categorical_features)
test = pd.get_dummies(test, columns=categorical_features)
学習データ作成
学習データからラベルを取得
train_labels = train['transactionRevenue'].values
train = train.drop(['transactionRevenue'], axis=1)
ダミー変数を作成した際に、列の数が異なってしまったため以下を実施し,0で置き換え
train, test = train.align(test, join='outer', axis=1)

# replace the nan values added by align for 0
train.replace(to_replace=np.nan, value=0, inplace=True)
test.replace(to_replace=np.nan, value=0, inplace=True)
訓練データ作成
X_train, X_val, Y_train, Y_val = train_test_split(train, train_labels, test_size=0.1, random_state=1)
学習に必要な設定
BATCH_SIZE = 128
EPOCHS = 5
LEARNING_RATE = 0.001
モデル作成
model = Sequential()
model.add(Dense(512, kernel_initializer='glorot_normal', activation='relu', input_dim=X_train.shape[1]))
model.add(Dense(256, kernel_initializer='glorot_normal', activation='relu'))
model.add(Dense(64, kernel_initializer='glorot_normal', activation='relu'))
model.add(Dense(32, kernel_initializer='glorot_normal', activation='relu'))
model.add(Dense(1))

adam = optimizers.adam(lr=LEARNING_RATE)
model.compile(loss='mse', optimizer=adam)
学習
history = model.fit(x=X_train.values, y=Y_train, batch_size=BATCH_SIZE, epochs=EPOCHS,
                    verbose=2, validation_data=(X_val.values, Y_val))
テストデータに対して、予測
predictions = model.predict(test)
提出ファイル作成
submission = pd.DataFrame({"fullVisitorId":test_ids})
submission.loc[:, 'PredictedLogRevenue'] = np.log1p(predictions)
grouped_test = submission[['fullVisitorId', 'PredictedLogRevenue']].groupby('fullVisitorId').sum().reset_index()
grouped_test.to_csv('submit.csv',index=False)
結果
エラーになってしまい提出できませんでした、、、、(別のカーネルに取り組みます)