企業の財務状況(バランスシート、損益計算書の代表指標の具合)を可視化するプログラムを書きました。
使用したのはprocessing3です。
ソースコードはこの記事の最後にあります。
credit
作成にあたり、以下の資産を使わせて頂きました。
ありがとうございます。
JT
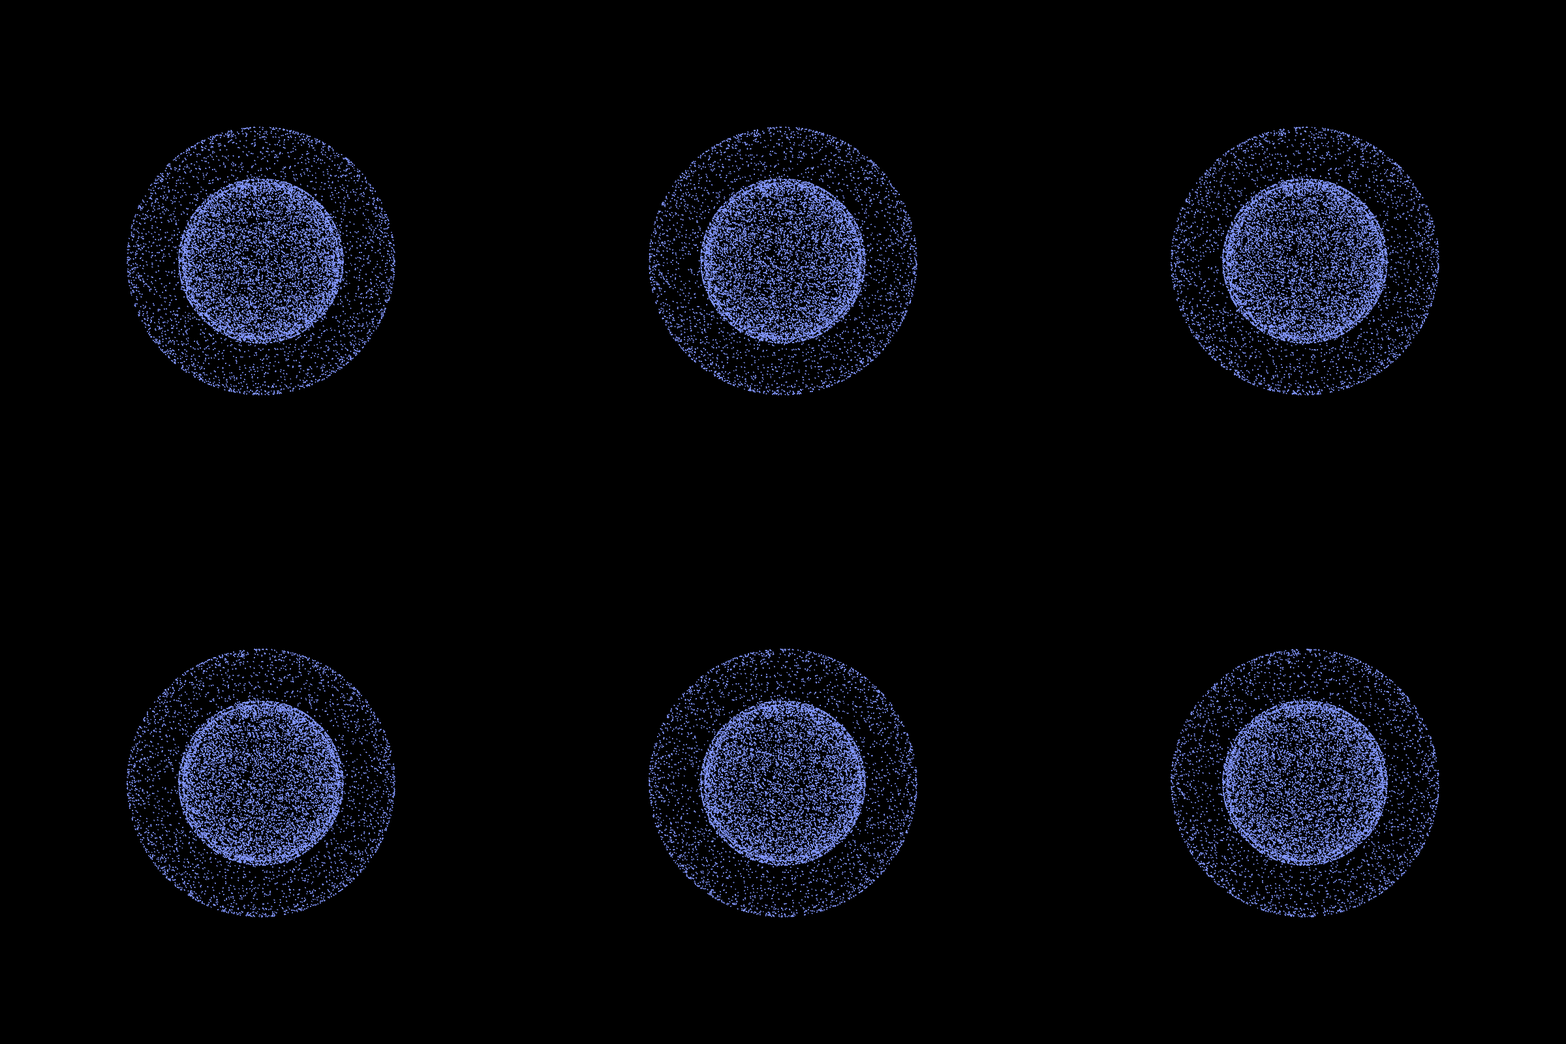
まずはJTの2015年の財務状況を表す、こちらのアニメーションをご覧ください。

雑に解説すると、
- 一番外側の大きな球が売上を、2番目に大きな球が営業利益を、そして一番小さい球が純利益を、その体積で表しています。
- (JTの営業利益と純利益はかなり近いため、内側の2つの球はほとんど重なって見えます)
- 全体の色が赤いほど借金体質です。(流動比率)
- JTはかなり青くて、これは返済が近い借金に対して、お金を十分に持っているってことです。返済能力高い。
- 球の回転スピードは勝負体質的なものを表しています。(レバレッジ比率)
- JTは結構遅め。つまり保守的というか、身の丈にあった投資をしているというか、十分な資金があるので投資のために借り入れをする必要が少ないというか、そういう感じです。
- ドットの密度は、どれだけ効率良く会社の資産を売上に変えているか、を表しています。(ROA)
- JTはけっこう効率いいんじゃないかな。(雑)
Softbank
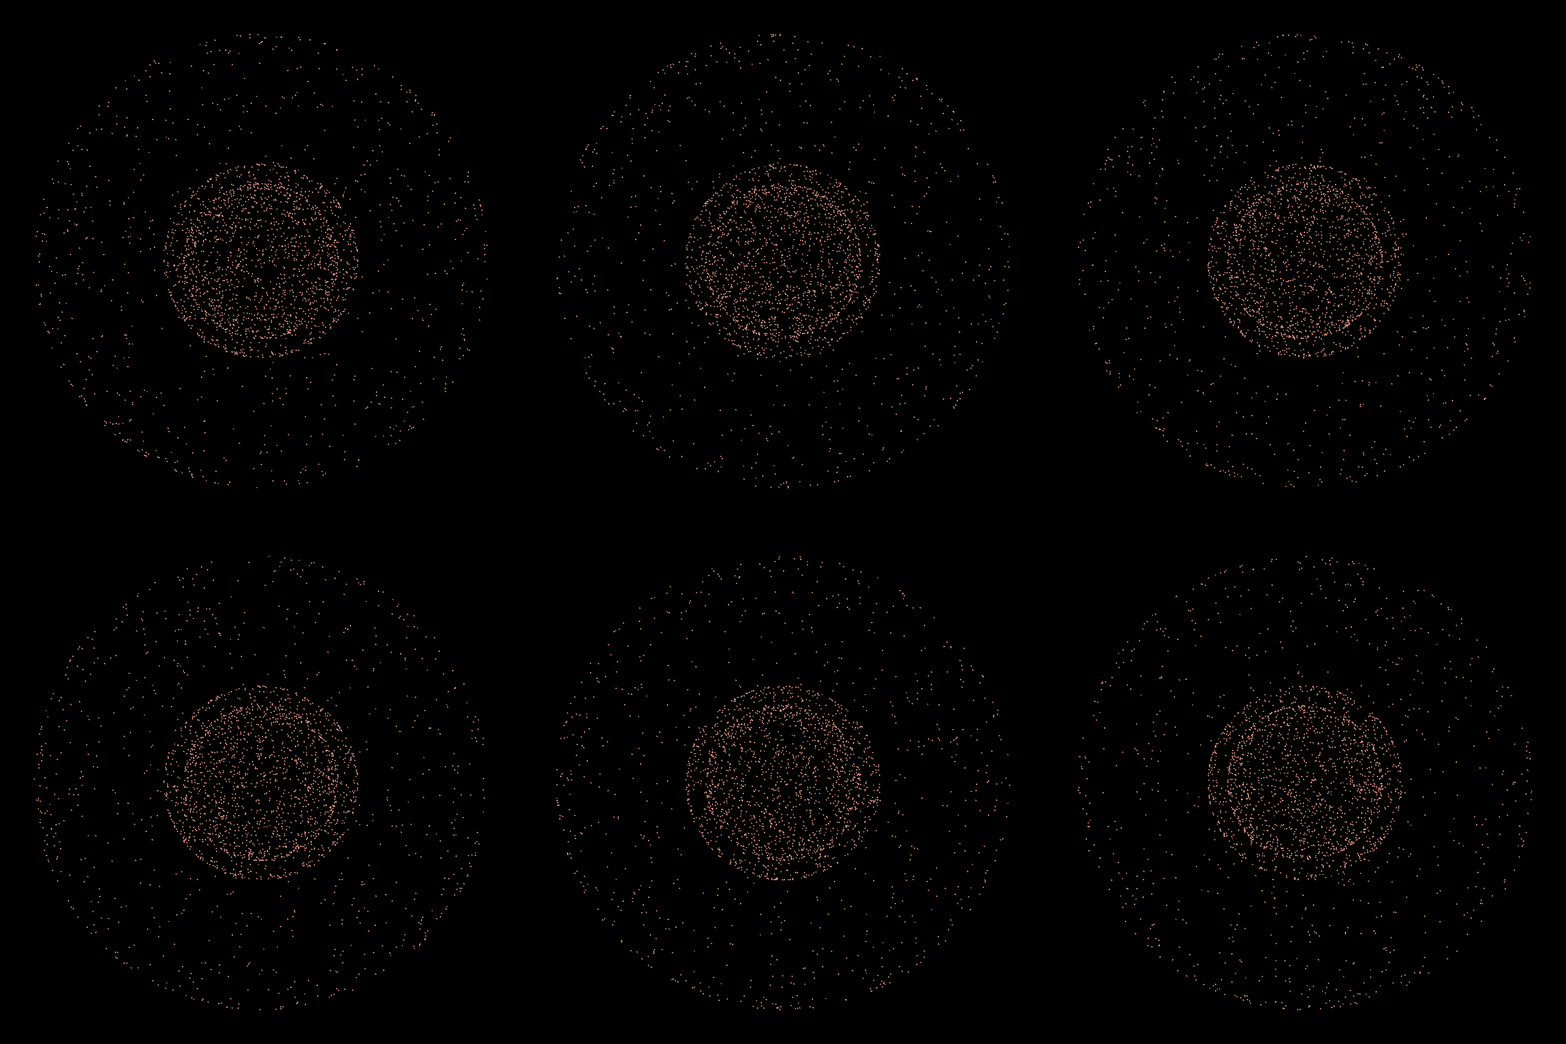
- Softbankは外側の球が相当でかくて、JTよりも売上はずっと大きいのがわかります。
- でも一番内側の球は同じくらいの大きさで、純利益はJTとだいたい同じくらいかなぁと読み取れます。
- 色がオレンジがかってて、これは、会社が持ってるお金(に近い物)に比べて返済が迫ってる借金が多いってこと。攻めてる。
- 球の回転スピードはかなり早くて、これは相当攻めた投資をしている。持ってるお金以上の投資をするために、銀行等からかなり借金をしてるんだろう。
- ドットの密度はまばらなので、資産(借金含む)を売上に変える効率はそんなに良くない。ただこれは業界の効率が悪い可能性もあるので同業他者と比べないとなんともいえない。
Panasonic
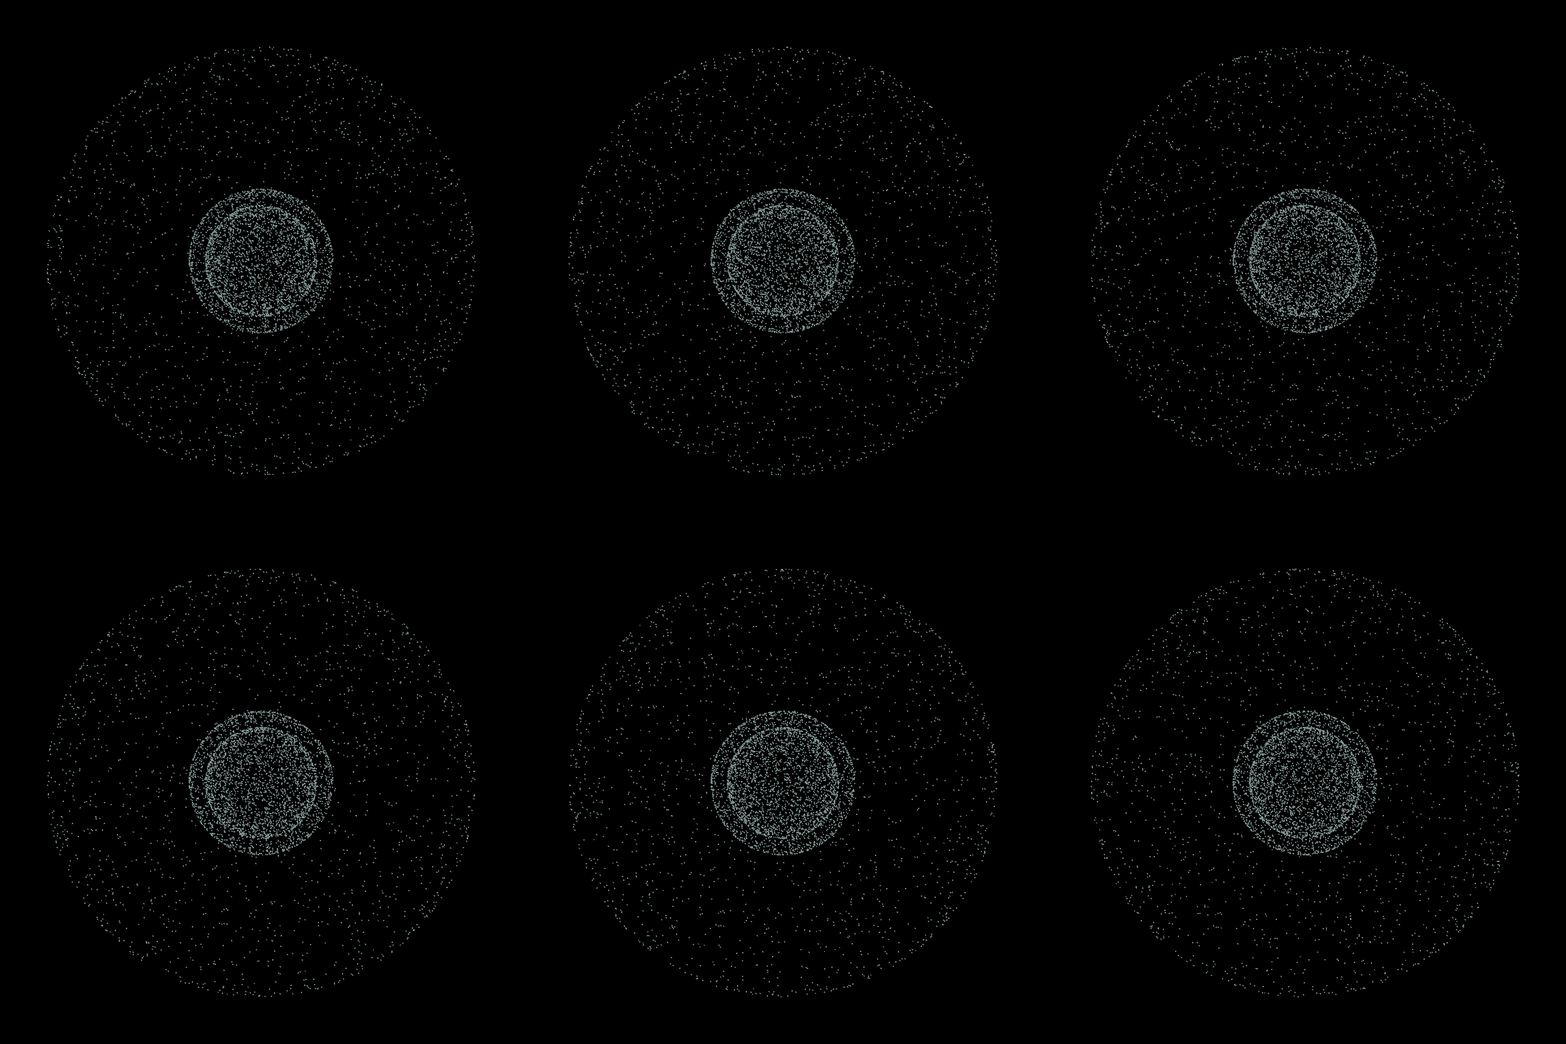
- JTとSoftbankの中間って感じ
- 売上はJTよりも結構大きい。球がでかくておっきな会社だ。
- 緑は、青と赤の中間です。JTほど保守的な投資姿勢じゃないけど、softbankほどリスクはとってない。
Recruit
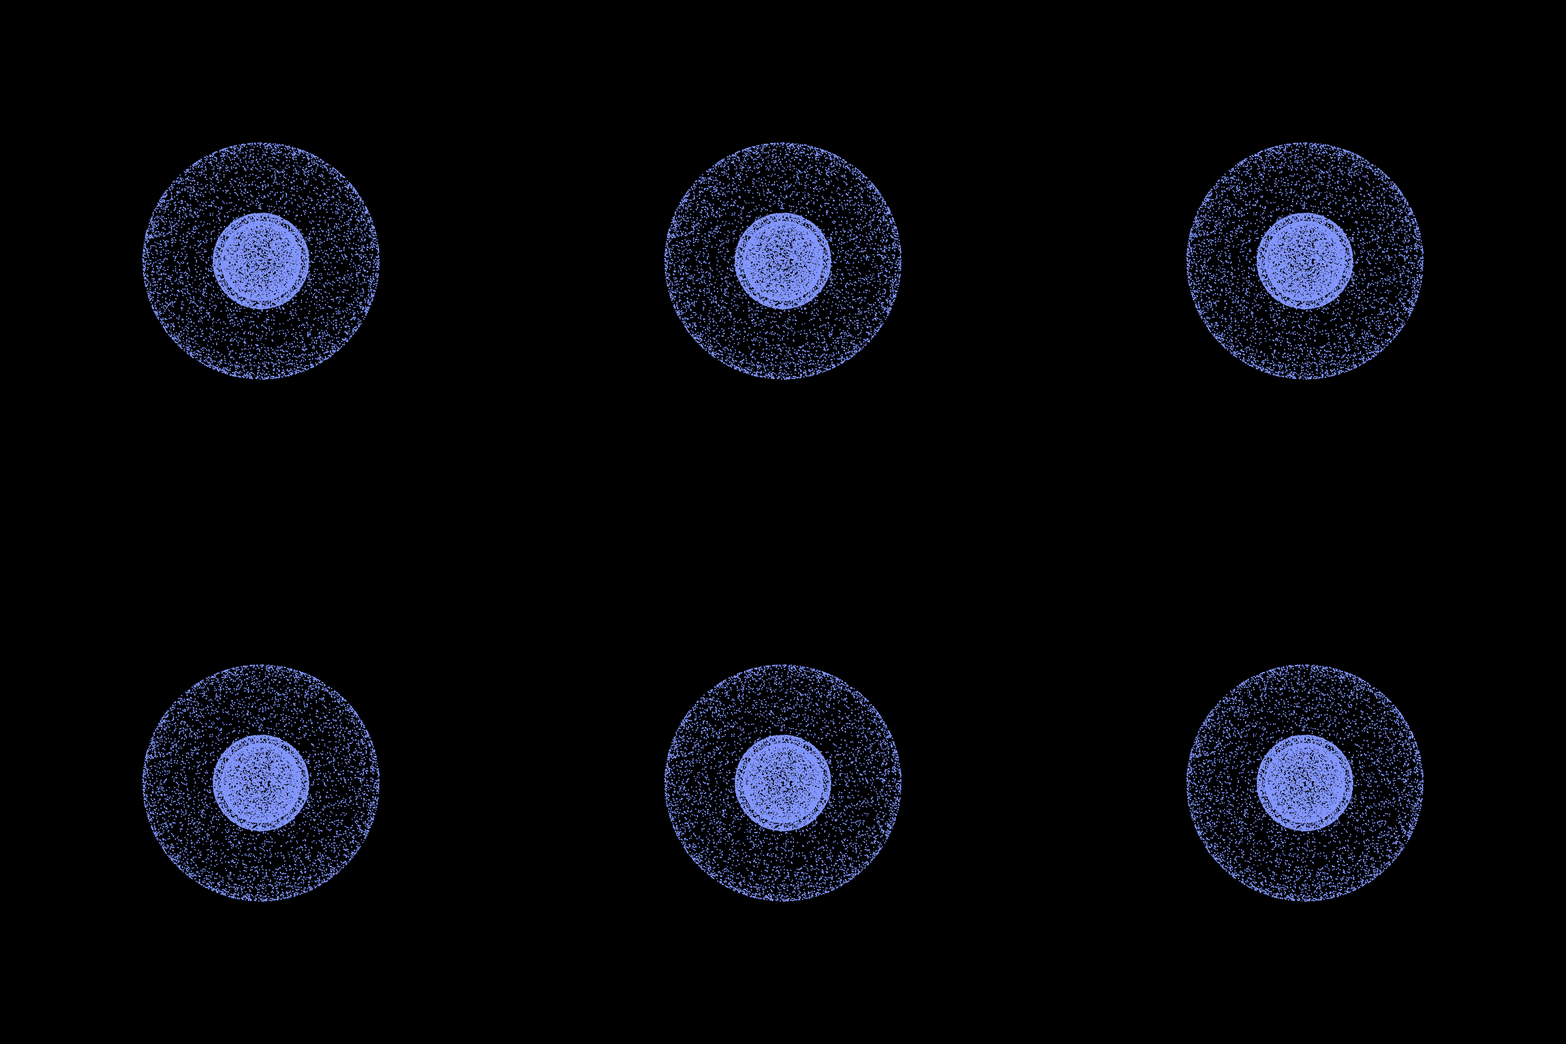
- 意外だったのは、球の回転がめちゃ遅い = 相当保守的な投資姿勢だってこと。金融機関からの借金がめちゃ少ない。
- 昔はかなり借りてたみたいたけど、上場(2014年)前に時間をかけて、有利子負債を返しまくって、体質改善を図ったようです。
- すごく青いのも、借金体質じゃないってのを表してる。
- ドットの密度は明らかに高くて、これは業種によるものなのかなー。資産をとても効率よく使って売上を生んでいる。
ポイント
例えばこれらの数値の可視化は、レーダーチャートを使うのも手だと思います。
しかし、レーダーチャートとは違い、こういったタイプの可視化を行うと、より感覚的に状況が把握できるのではないかと思います。
例えば、赤は赤字を連想させ、説明が無くても直感的に財務状況が悪い気がする、だとか。
動きが早いのは焦ってるような印象を与える、だとか。
今回実装してませんが、ドットの分布が不均一の場合は安定感に欠け、不安な気がする、だとか。
そういった、人間の経験からくる感覚や、直感に紐付いた可視化ができれば、ひと目で企業間の比較や同企業の年度間の比較ができるのではないでしょうか。
Features
- 財務状況はcsvファイルから読み取るようにしています
Requirement
- processing3
ソースコード
year,年,2015
total asset,総資産,4558
earning,売上,2253
op profit,営業利益,565
net profit,純利益,490
liq assets,流動資産,1798
liq debt,流動負債,1265
net asset,純資産,2522
debt w/ int,有利子負債,246
//JT 2015
String company = "jt2015.csv";

GIFAnimeWriter gif;

Table table;

private Plot[] earning_plots;
private Plot[] operatingProfit_plots;
private Plot[] netProfit_plots;

float total_asset;
float net_profit;
float operatingProfit;
float earning;
float liquid_assets;
float liquid_dept;
float net_asset;
float debt_with_interest;

float leverage_ratio;

void setup() {

  table = loadTable(company);
    total_asset = table.getInt(1,2);
    earning = table.getInt(2,2);
    operatingProfit = table.getInt(3,2);
    net_profit = table.getInt(4,2);
    liquid_assets = table.getInt(5,2);
    liquid_dept = table.getInt(6,2);
    net_asset = table.getInt(7,2);
    debt_with_interest = table.getInt(8,2);

  //size of circle : Earning, operating profit, net profit(bottom line)
  float magnifying_ratio = 15;
  float earning_radius = magnifying_ratio*pow(earning, (1.0/3.0));
  float operatingProfit_radius = magnifying_ratio*pow(operatingProfit, (1.0/3.0));
  float netProfit_radius = magnifying_ratio*pow(net_profit, (1.0/3.0));

  //standardize ROA by deviding by sqrt(net_profit) which is in proportion to surface area of the core sphere
  int roa = int((net_profit*800000/total_asset)/sqrt(net_profit)); //about 1000-3000

  //if ratio > 1.2, it is safe (blue) / if ratio < 0.8 it is dangerous (red).
  //bigger the liquid_ratio, the safer it gets
  float liquid_ratio = liquid_assets/liquid_dept;
  int blue = 0;
  int red = 0;

  //leverage ratio
  leverage_ratio = debt_with_interest / net_asset;

  earning_plots = new Plot[roa];
  operatingProfit_plots = new Plot[roa];
  netProfit_plots = new Plot[roa];

  gif = new GIFAnimeWriter(company+".gif",GIFAnimeWriter.LOOP);
  size(800, 800, P3D);
  frameRate(20);

  for (int i = 0; i < roa; i++) {
    earning_plots[i] = new Plot(earning_radius);
    operatingProfit_plots[i] = new Plot(operatingProfit_radius);
    netProfit_plots[i] = new Plot(netProfit_radius);
  }

  // plot color and plot size
  if(liquid_ratio > 1.2){
    red = 30;
    blue = int(1000*(liquid_ratio-1.2));
  }
  if(liquid_ratio < 1.2){
    blue = 30;
    red = int(1000*(1.2-liquid_ratio));
  }
  stroke(100+red, 150, 100+blue, 255);
  strokeWeight(2);
}

void draw() {
  background(0);
  // move the center point
  translate(width/2, height/2, 0);

  //rotationSpeed = Leverage Ratio (about 0.002)
  float rotationSpeed = leverage_ratio/80;

  rotateY(frameCount*rotationSpeed);
  rotateZ(frameCount*rotationSpeed);
  for (Plot earning_p : earning_plots) {
    point(earning_p.x, earning_p.y, earning_p.z);
  }

  rotateY(frameCount*-rotationSpeed);
  rotateZ(frameCount*-rotationSpeed);
  for (Plot operatingProfit_p : operatingProfit_plots) {
    point(operatingProfit_p.x, operatingProfit_p.y, operatingProfit_p.z);
  }

  rotateY(frameCount*rotationSpeed);
  rotateZ(frameCount*rotationSpeed);
  for (Plot netProfit_p : netProfit_plots) {
    point(netProfit_p.x, netProfit_p.y, netProfit_p.z);
  }

  gif.stock(g);
  if (frameCount >= 100) exit();
}


private class Plot {
  final float x, y, z;
  Plot(float radius) {
    // randomly calculate position on sphere
    float unitZ = random(-1, 1);
    float radianT = radians(random(360));
    x = radius * sqrt(1 - unitZ * unitZ) * cos(radianT);
    y = radius * sqrt(1 - unitZ * unitZ) * sin(radianT);
    z = radius * unitZ;
  }
}

void exit() {
  gif.write();
  super.exit();
}


