はじめに
PHPでグラフ付きのエクセルを出力する方法を紹介します。
マクロ付きのエクセルをテンプレートとして読み込む方法もありますが、
ここではPhpSpreadsheetでグラフを直接作成してみたいと思います。
出力エクセル
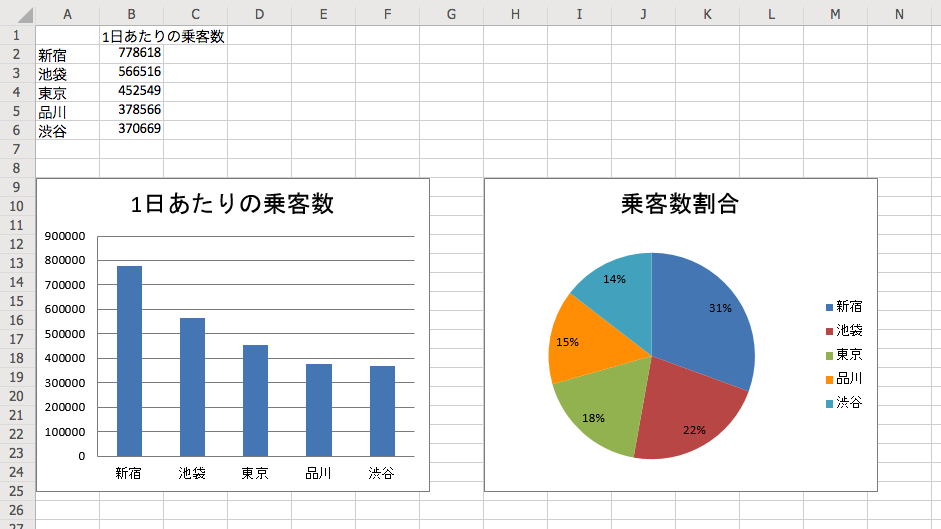
山手線5駅の1日あたりの乗客数をデータにして、棒グラフと円グラフ付きのエクセルを作成してみます。
use
SpreadsheetとWriter\Xlsxはエクセルを作成する上で基本となるクラスです。
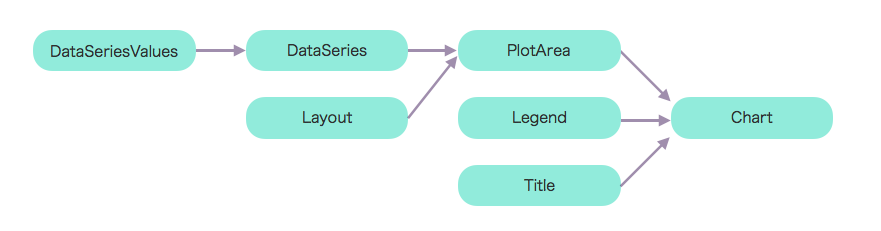
グラフを作成するのはChart\Chartで、それ以降はChartを構成する要素を作成するためのクラスになります。
<?php

require 'vendor/autoload.php';

use PhpOffice\PhpSpreadsheet\Spreadsheet;
use PhpOffice\PhpSpreadsheet\Writer\Xlsx;
use PhpOffice\PhpSpreadsheet\Chart\Chart;
use PhpOffice\PhpSpreadsheet\Chart\DataSeries;
use PhpOffice\PhpSpreadsheet\Chart\DataSeriesValues;
use PhpOffice\PhpSpreadsheet\Chart\Layout;
use PhpOffice\PhpSpreadsheet\Chart\Legend;
use PhpOffice\PhpSpreadsheet\Chart\PlotArea;
use PhpOffice\PhpSpreadsheet\Chart\Title;
チャートの構成要素となるPlotArea、Legend、TitleをChartクラスに放り込むイメージです。
また、PlotAreaはDataSeriesとLayoutから構成されます。
乗客数データ
新しいSpreadsheetを作成してデータを入れます。
fromArrayを使うと配列でセルに値を入ることができます。
$spreadsheet = new Spreadsheet();
$worksheet = $spreadsheet->getActiveSheet();
$worksheet->fromArray(
  [
    ['', '1日の乗客数'],
    ['新宿', 778618],
    ['池袋', 566516],
    ['東京', 452549],
    ['品川', 378566],
    ['渋谷', 370669],
  ]
);
棒グラフ
まず、X軸とデータの範囲を決めます。
$xAxisTickValues = [
	new DataSeriesValues(DataSeriesValues::DATASERIES_TYPE_STRING, 'Worksheet!$A$2:$A$6', null, 5), // 新宿 ~ 渋谷
];

$dataSeriesValues = [
	new DataSeriesValues(DataSeriesValues::DATASERIES_TYPE_NUMBER, 'Worksheet!$B$2:$B$6', null, 5),  // 乗客数の各値
];
データシリーズを作る時にグラフのタイプを決めます。
棒グラフなのでTYPE_BARCHARTを指定します。
$series = new DataSeries(
	DataSeries::TYPE_BARCHART, // plotType
	DataSeries::GROUPING_STANDARD, // plotGrouping
	range(0, count($dataSeriesValues) - 1), // plotOrder
	[], // plotLabel
	$xAxisTickValues, // plotCategory
	$dataSeriesValues // plotValues
);

$series->setPlotDirection(DataSeries::DIRECTION_COL);
先ほどのデータシリーズからプロットエリアを作ります。
$plotArea = new PlotArea(null, [$series]);
タイトルもクラスを使います。
$title = new Title('1日の乗客数');
棒グラフの要素が整ったので、これらをまとめてChartクラスに入れてやります。
$chart = new Chart(
    'bar chart', // name
    $title, // title
    null, // legend
    $plotArea, // plotArea
    true, // plotVisibleOnly
    0, // displayBlanksAs
    null, // xAxisLabel
    null  // yAxisLabel
);
あとは開始位置と終了位置を指定して、ワークシートに追加するだけです。
$chart->setTopLeftPosition('A8');
$chart->setBottomRightPosition('G24');
$worksheet->addChart($chart);
円グラフ
円グラフを作る時はTYPE_PIECHARTを指定します。
$series = new DataSeries(
	DataSeries::TYPE_PIECHART, // plotType
	null, // plotGrouping
	range(0, count($dataSeriesValues) - 1), // plotOrder
	[], // plotLabel
	$xAxisTickValues, // plotCategory
	$dataSeriesValues // plotValues
);
円グラフにはレイアウトも必要なので作成します。
レジェンドも追加します。
$layout = new Layout();
$layout->setShowPercent(true);
$plotArea = new PlotArea($layout, [$series]);

$legend = new Legend(Legend::POSITION_RIGHT, null, false);

$title = new Title('乗客数割合');

$chart = new Chart(
	'pie chart', // name
	$title, // title
	$legend, // legend
	$plotArea, // plotArea
	true, // plotVisibleOnly
	0, // displayBlanksAs
	null, // xAxisLabel
	null   // yAxisLabel
);

$chart->setTopLeftPosition('H8');
$chart->setBottomRightPosition('N24');

$worksheet->addChart($chart);
あとはエクセルを出力するだけです。
$writer = new Xlsx($spreadsheet);
$writer->setIncludeCharts(true);
$writer->save('passengers.xlsx');