はじめに
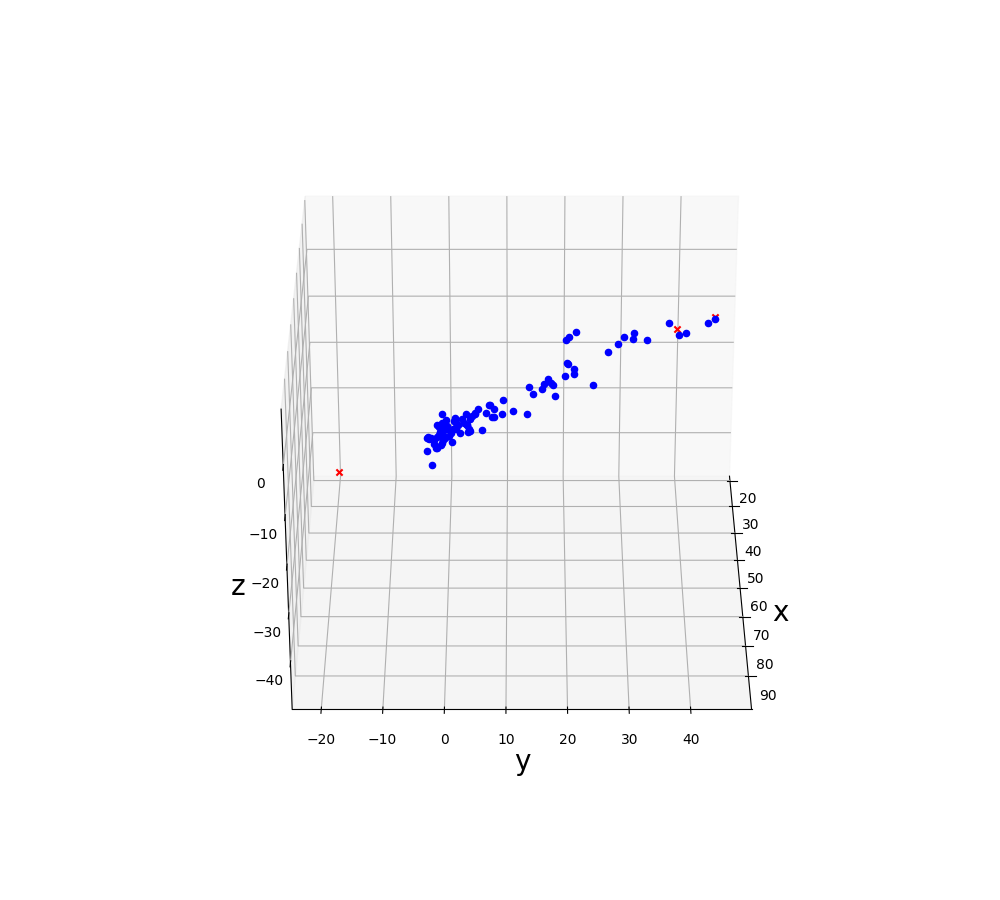
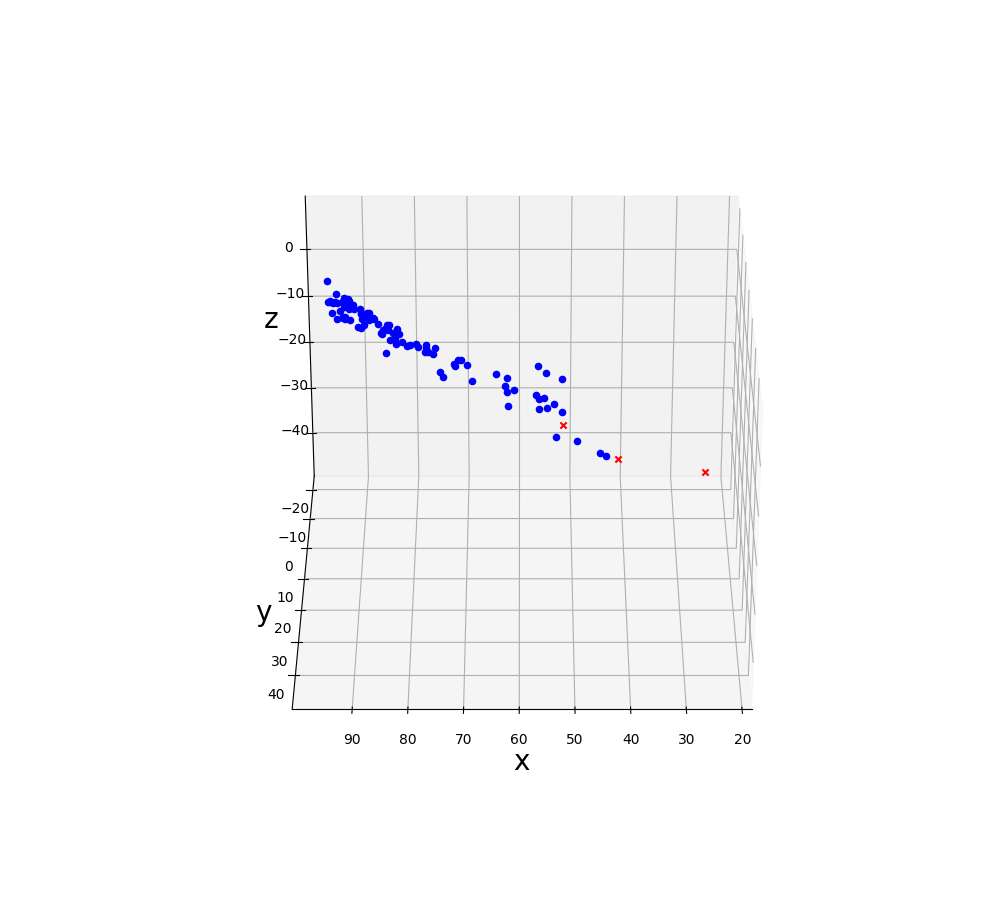
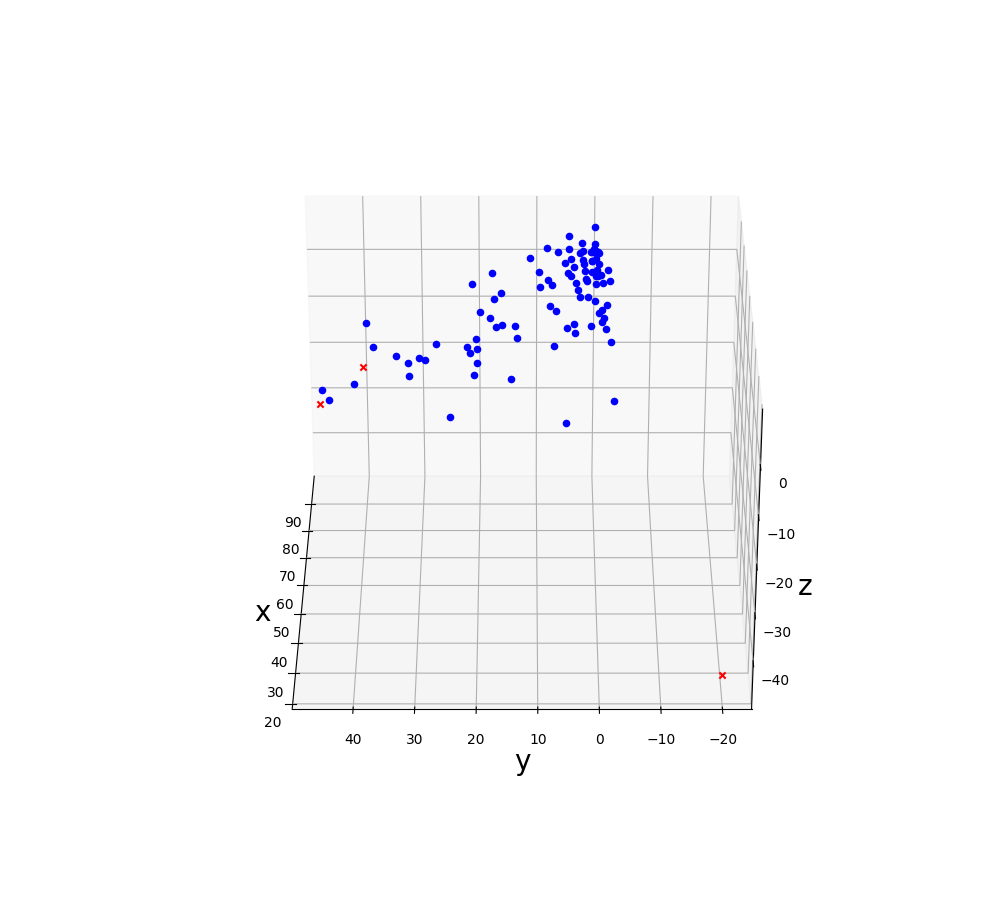
深層学習で予測した結果のうち誤差が大きいものと,誤差が小さいものに特徴はあるのか可視化して確認したかったので,3Dグラフにプロットしてみました.
- 予測に失敗:赤
- 予測に成功:青
で示しています.
使ったライブラリ
- matplotlib
- pandas
- Pillow
3D表示
Matplotlib公式が色分けの散布図の表示の仕方を載せていたので参考にしました.
mplot3d tutorial — Matplotlib 2.0.2 documentation
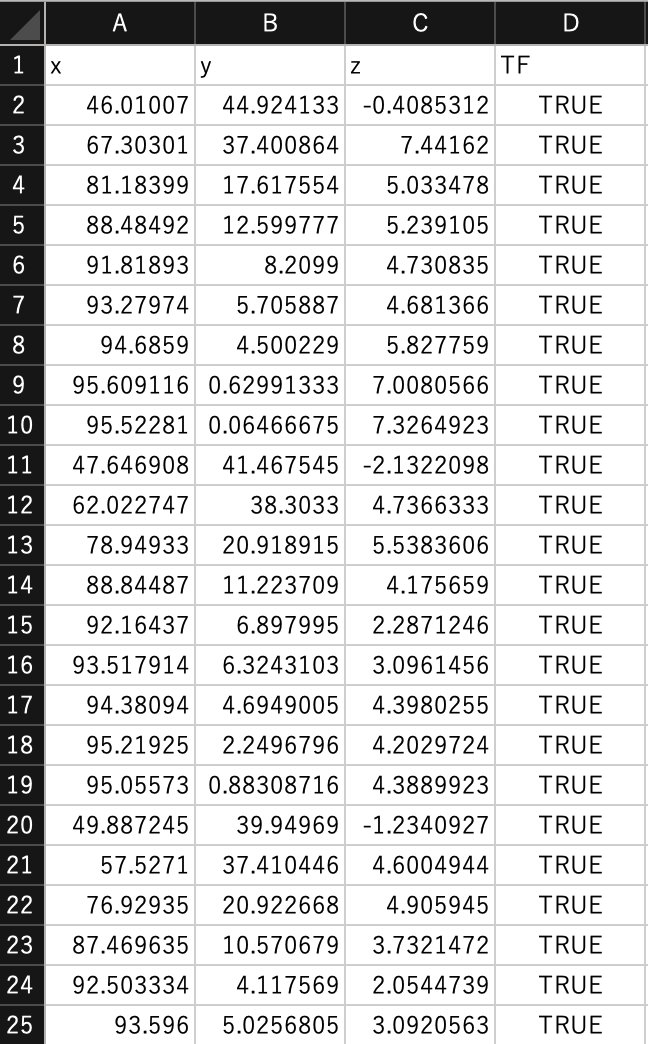
使うデータ
x, y, z, TFとラベル付けしました.
描画
plot3d.py
import pandas as pd
import matplotlib.pyplot as plt
from mpl_toolkits.mplot3d import Axes3D
from io import BytesIO
from PIL import Image

import_path = './test.csv'


def main():
    fig = plt.figure(figsize=(10.0, 9.0))
    ax = fig.add_subplot(111, projection='3d')

    data = pd.read_csv(import_path, header=0)
    print(data)
    for index, row in data.iterrows():
        print('\rindex = {}/{}, TorF = {}  '.format(index,len(data), str(row['TF'])),end="")
        color = 'r'
        marker = 'x'
        if str(row['TF']) == 'True':
            color = 'b'
            marker = 'o'
        ax.scatter(row['x'], row['y'], row['z'], c = color, marker = marker)

    print('\n---Finished Loading---')
    ax.set_xlabel("x", fontsize=20)
    ax.set_ylabel("y", fontsize=20)
    ax.set_zlabel("z", fontsize=20)
    ax.view_init(30, 0)
    plt.savefig('./output2D-1.png')
    ax.view_init(30, 90)
    plt.savefig('./output2D-2.png')
    ax.view_init(30, 180)
    plt.savefig('./output2D-3.png')


if __name__ == '__main__':
    main()
描画した結果
3D表示を回転させる
GIFアニメにすることで回転させてみました.
こちらの記事を参考にさせていただきました.
3D 散布図を回転 GIF アニメーションにする - Qiita
plot3d.py
import pandas as pd
import matplotlib.pyplot as plt
from mpl_toolkits.mplot3d import Axes3D
from io import BytesIO
from PIL import Image
import time
import datetime

import_path = './test.csv'


def  render_frame(ax, angle):
    print('\rangle = {}'.format(angle),end="")
    ax.view_init(30, angle)
    buf = BytesIO()
    plt.savefig(buf, bbox_inches='tight', pad_inches=0.0)
    return Image.open(buf)


def main():
    start = time.time()
    fig = plt.figure(figsize=(10.0, 9.0))
    ax = fig.add_subplot(111, projection='3d')

    data = pd.read_csv(import_path, header=0)
    for index, row in data.iterrows():
        print('\rindex = {}/{}, TorF = {}  '.format(index,len(data), str(row['TF'])),end="")
        color = 'r'
        marker = 'x'
        if str(row['TF']) == 'True':
            color = 'b'
            marker = 'o'
        ax.scatter(row['x'], row['y'], row['z'], c = color, marker = marker)

    ax.set_xlabel("x", fontsize=20)
    ax.set_ylabel("y", fontsize=20)
    ax.set_zlabel("z", fontsize=20)

    print('\n---Finished Loading---\n')
    images = [render_frame(ax, angle) for angle in range(50)]
    images[0].save('output3D.gif', save_all=True, append_images=images[1:], duration=100, loop=0)

    # 経過時間の集計
    process_time = time.time() - start
    td = datetime.timedelta(seconds=process_time)
    print('PROCESS TIME = {}'.format(td))


if __name__ == '__main__':
    main()
GIFアニメ