はじめに
当記事はkaggleのLearnのIntro to Machine LearningのLine Chartsを翻訳して備忘としたものです。
拙い英語力なので間違い等あればご指摘いただけたらと思います。
まとめ:【kaggle】翻訳記事まとめ【備忘翻訳】
前:【kaggle】データの視覚化 - Hello, Seaborn【備忘翻訳】
次:【kaggle】データの視覚化 - 棒グラフとヒートマップ【備忘翻訳】
当記事に含まれるコードはkaggle内のnotebook内で正常に動作します。動作を試したい場合はkaggleのnotebookで試してください。
折れ線グラフ
時系列でトレンドを可視化
コーディング環境に慣れたら、次は独自のチャートを作成する方法を学びましょう。
このチュートリアルでは本格的な折れ線グラフをPythonで作成する方法を学びましょう。今回の演習では実際のデータセットを用いて新しいスキルを活用してみましょう。
notebookのセットアップ
まず、コーディング環境のセットアップから始めます。
details
import pandas as pd
pd.plotting.register_matplotlib_converters()
import matplotlib.pyplot as plt
%matplotlib inline
import seaborn as sns
print("Setup Complete")
Setup Complete
データの選択
このチュートリアルのデータセットは、音楽ストリーミングサービスSpotifyにおける世界中のデイリーの再生数を追跡します。2017年から2018年における5つの人気の楽曲に注目します。
- Ed Sheeranの「Shape of You」link
- Luis Fonziの「Despacito」link
- The Chainsmokers and Coldplayの「Something Just Like This」link
- Kendrick Lamarの「HUMBLE.」link
- French Montanaの「Unforgettable」link
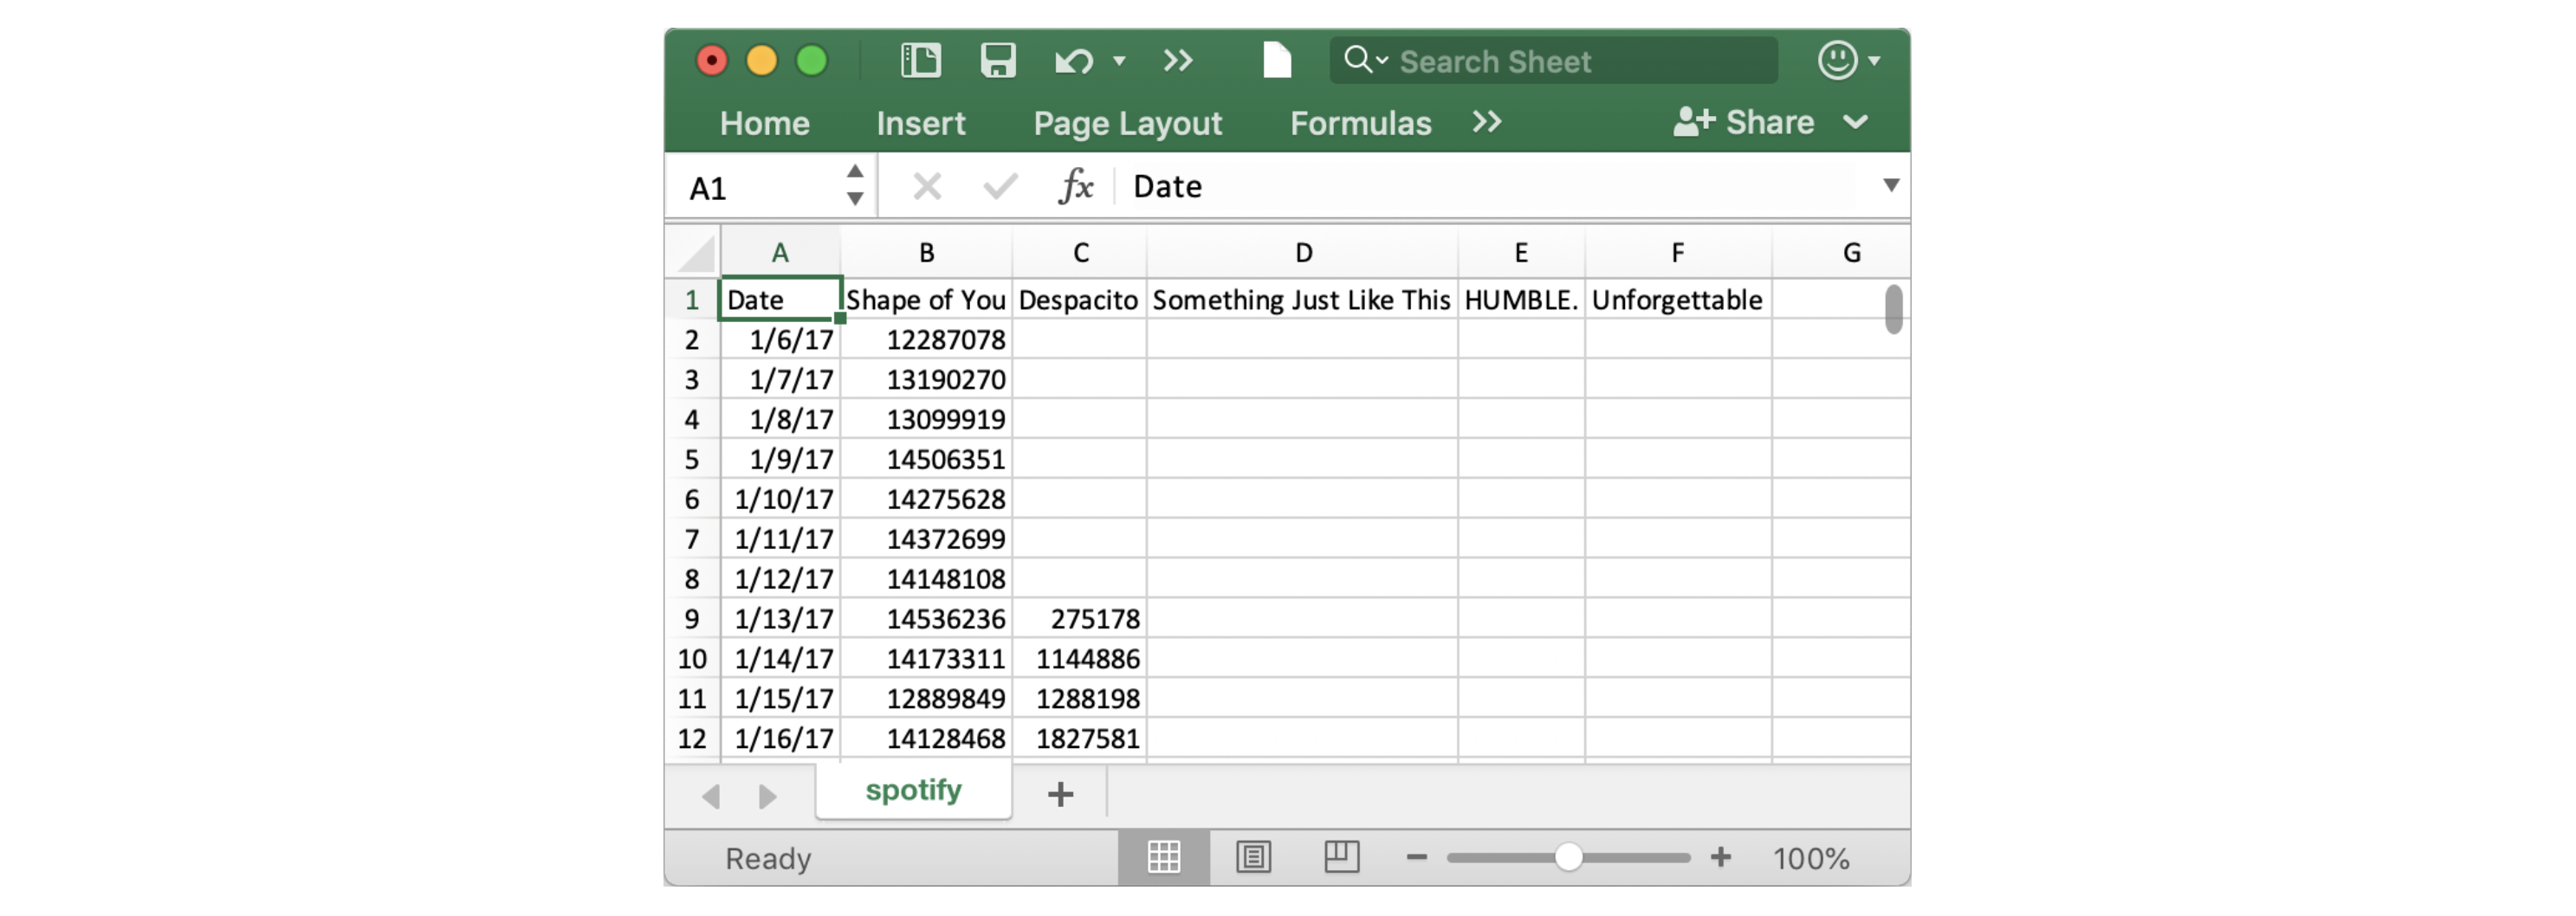
最初に表示される日付は2017年1月6日であり、これはEd Sheeranの「Shape of You」のリリース日と一致していることに注目してください。表を見ると、「Shape of You」はリリース当日に世界中で12,287,078回再生されたことがわかります。他の曲は後になってからリリースされたため、最初の行に欠損値があることに注目してください。
データの取り込み
前のチュートリアルで学習したように、pd.read_csvコマンドを使用してデータセットを読み取ります。
# Path of the file to read
spotify_filepath = "../input/spotify.csv"

# Read the file into a variable spotify_data
spotify_data = pd.read_csv(spotify_filepath, index_col="Date", parse_dates=True)
上記のコードを実行した結果、spotify_dataを使用してデータセットにアクセスできるようになります。
データの調査
前のチュートリアルで学習したheadコマンドを使用して、データセットの最初の5行を表示します。
# Print the first 5 rows of the data
spotify_data.head()
| Shape of You | Despacito | Something Just Like This | HUMBLE. | Unforgettable | |
|---|---|---|---|---|---|
| Date | |||||
| 2017-01-06 | 12287078 | NaN | NaN | NaN | NaN |
| 2017-01-07 | 13190270 | NaN | NaN | NaN | NaN |
| 2017-01-08 | 13099919 | NaN | NaN | NaN | NaN |
| 2017-01-09 | 14506351 | NaN | NaN | NaN | NaN |
| 2017-01-10 | 14275628 | NaN | NaN | NaN | NaN |
表示された最初の5行が、上記のデータセットのイメージ(Excelで表示されていたイメージ)と一致していることを確認します。
空のエントリは、「Not a Number」の略である
NaNとして表示されます。
少し変更するだけで(.head()を.tail()に変更)、データの最後の5行を確認することもできます。
# Print the last five rows of the data
spotify_data.tail()
| Shape of You | Despacito | Something Just Like This | HUMBLE. | Unforgettable | |
|---|---|---|---|---|---|
| Date | |||||
| 2018-01-05 | 4492978 | 3450315.0 | 2408365.0 | 2685857.0 | 2869783.0 |
| 2018-01-06 | 4416476 | 3394284.0 | 2188035.0 | 2559044.0 | 2743748.0 |
| 2018-01-07 | 4009104 | 3020789.0 | 1908129.0 | 2350985.0 | 2441045.0 |
| 2018-01-08 | 4135505 | 2755266.0 | 2023251.0 | 2523265.0 | 2622693.0 |
| 2018-01-09 | 4168506 | 2791601.0 | 2058016.0 | 2727678.0 | 2627334.0 |
ありがたいことに、それぞれの曲の毎日のグローバルストリームが何百万回も記録されており、全てがほぼ正しいように見えます。データのプロットに進みましょう。
データのプロット
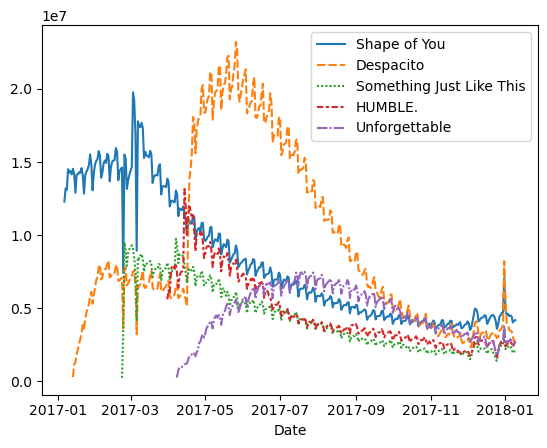
データセットがnotebookに読み込まれました。折れ線グラフを作成するために必要なコードは1行だけです。
# Line chart showing daily global streams of each song
sns.lineplot(data=spotify_data)
<AxesSubplot:xlabel='Date'>
上記のように、コードは比較的短く、2つの要素で構成されています。
-
sns.lineplotは、折れ線グラフを作成するコードです -
data=spotify_dataは、グラフの作成に使用するデータを選択します
折れ線グラフを作成するときは常にこの同じ形式を使用し、新しいデータセットで変更されるのは、データセットの名前のみであることに注意してください。したがって、たとえばfinancial_dataという名前の別のデータセットを操作している場合、コードは次の様になります。
sns.lineplot(data=financial_data)
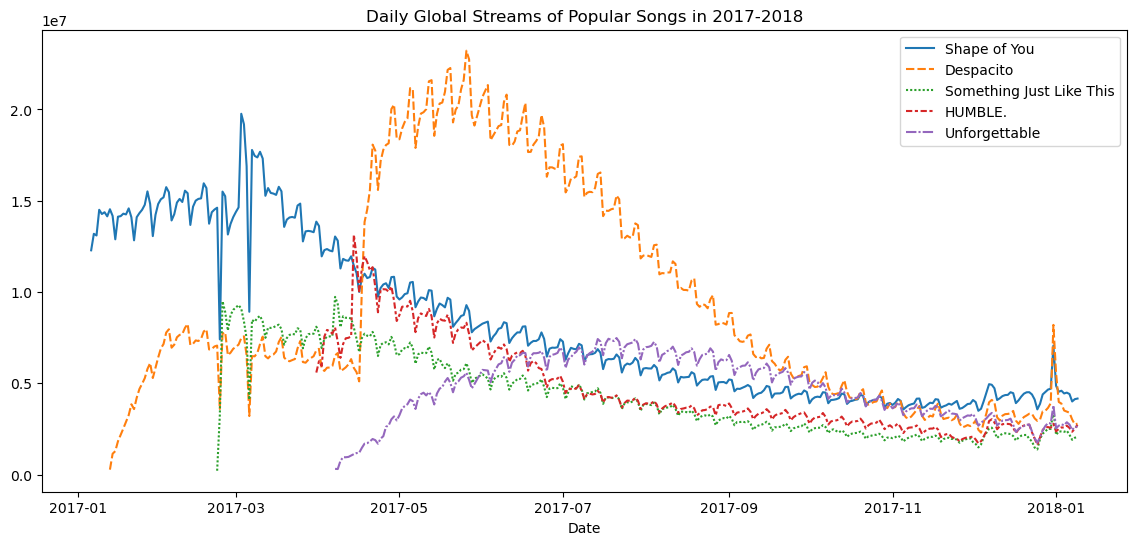
図のサイズやグラフのタイトルなど、変更したい追加の詳細がある場合もあります。それらの各オプションは1行のコードで簡単に設定できます。
# Set the width and height of the figure
plt.figure(figsize=(14,6))

# Add title
plt.title("Daily Global Streams of Popular Songs in 2017-2018")

# Line chart showing daily global streams of each song
sns.lineplot(data=spotify_data)
<AxesSubplot:title={'center':'Daily Global Streams of Popular Songs in 2017-2018'}, xlabel='Date'>
最初のコードは、図のサイズを14インチ(幅) x 6インチ(高さ)に設定しています。図のサイズをカスタマイズしたい場合は、14と6の値を目的の値に変更してください。
コードの2行目は図のタイトルを設定します。タイトルは引用符("...")で囲む必要があります。
データのサブセットをプロットする
これまで、データセットないの全ての列を折れ線グラフにプロットする方法を学習しました。このセクションでは、列のサブセットをプロットする方法を学習します。
まず、全ての列の名前を表示します。これは1行のコードだけで実行でき、データセットの名前(spotify_data)を書き換えるだけで、任意のデータセットの列名を表示させることができます。
list(spotify_data.columns)
['Shape of You',
 'Despacito',
 'Something Just Like This',
 'HUMBLE.',
 'Unforgettable']
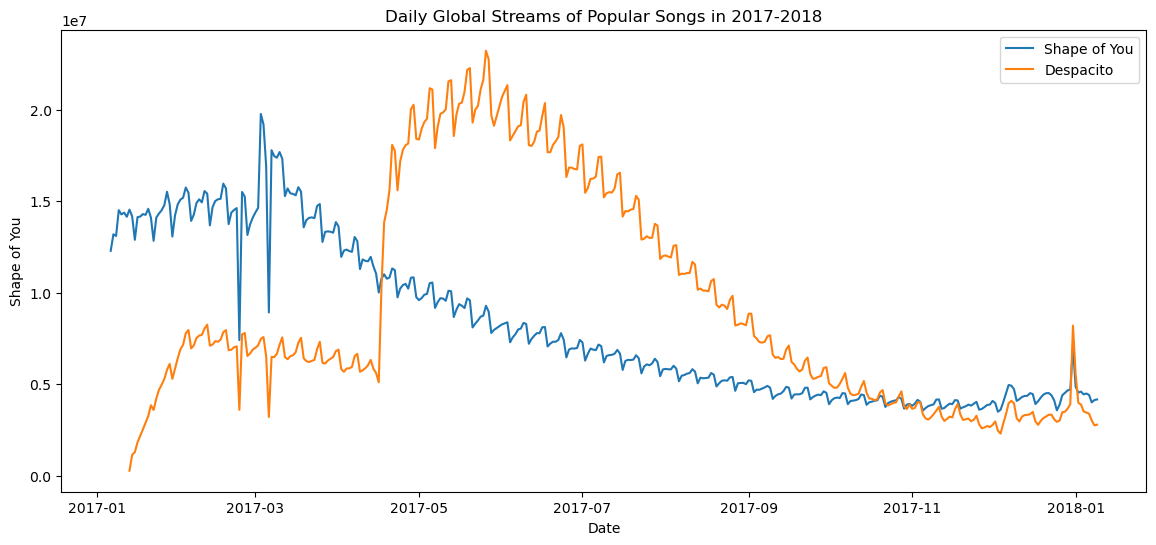
次のコードでは、データセットの最初の2つの列のみの折れ線グラフをプロットします。
# Set the width and height of the figure
plt.figure(figsize=(14,6))

# Add title
plt.title("Daily Global Streams of Popular Songs in 2017-2018")

# Line chart showing daily global streams of 'Shape of You'
sns.lineplot(data=spotify_data['Shape of You'], label="Shape of You")

# Line chart showing daily global streams of 'Despacito'
sns.lineplot(data=spotify_data['Despacito'], label="Despacito")

# Add label for horizontal axis
plt.xlabel("Date")
Text(0.5, 0, 'Date')
コードの最初の2行は、図のタイトルとサイズを設定しています。
次の2行はそれぞれ折れ線グラフに線を追加します。「Shape of You」の線を追加する最初の行を見てみましょう。
# Line chart showing daily global streams of 'Shape of You'
sns.lineplot(data=spotify_data['Shape of You'], label="Shape of You")
このコードは全ての列をプロットした際のコードと非常によく似ていますが、いくつか大きな違いがあります:
-
data=spotify_dataを設定する代わりにdata=spotify_data['Shape of You']を設定しています。一般的に、1つの列のみをプロットするには、列名をシングルクオテーションで囲み、角括弧で囲むこの形式を使用します。 - また、凡例に線が表示されるように
label="Shape of You"を追加し、対応するラベルを設定します。 - 最後の行のコードは、水平軸(x軸)のラベルを変更します。必要なラベルは引用符(
"...")で囲まれます。


