この記事は、Akashic Engine Advent Calendar 2019の4日目の記事です。
はじめに
Akashic Engine は JavaScript で動作するマルチメディアライブラリです。ニコニコ生放送で動くゲームの開発に使われています。Akashic Engine で何ができるかは以下の入門を読むと分かります。
Akashic Engine はとてもプリミティブな機能しか用意されておらず、例えば線を描くという機能がありません。マルチプラットフォームのマルチメディアライブラリの SDL (Simple DirectMedia Layer) に線を描く命令がないのと似ています。
この記事では、Akashic Engine の FilledRect を利用して線を描く方法を説明します。記事中のコードは TypeScript で書かれています。
FilledRect
Akashic Engine の FilledRect は塗り潰した矩形を描画します。以下は座標 (100, 80) に幅 80 高さ 40 の赤色の矩形を作るコードです。
const rect = new g.FilledRect({
  scene,
  cssColor: "#ff0000",
  x: 100,
  y: 80,
  width: 80,
  height: 40
});
akashic-sandbox でグリッド付きで表示する以下のようになります。
FilledRect は矩形の左上頂点までの距離で座標を指定します。FilledRect には回転角を指定する angle プロパティがあります。angle プロパティには角度を度数で表します。例えば 15 度傾ける場合は以下のコードになります。
const rect = new g.FilledRect({
  scene,
  cssColor: "#ff0000",
  x: 200,
  y: 100,
  width: 300,
  height: 200,
  angle: 15
});
実行すると以下の表示になります。
矩形の中心座標を中心に時計回りに回転します。回転の中心座標が矩形の左上ではない点に注意が必要です。
FilledRect で線分を描く
Akashic Engine の FilledRect は回転させることができるので、細長い FilledRect を回転させることで、2点を結ぶ線分を描画できます。
ここでは (x1, y1) から (x2, y2) までの線分を描くのに必要な FilledRect のプロパティ x, y, width, height, angle を計算します。
最初に線の太さを決めます。
const lineWidth = 5;
線の長さは2点間の距離になるので、
const lineLength = Math.sqrt(Math.pow(x2 - x1, 2) + Math.pow(y2 - y1, 2));
直線の角度を Math.atan2 で計算します。180 / Math.PI をかけて孤度法から度数法に変換します。
const lineAngle = Math.atan2(y2 - y1, x2 - x1) * (180 / Math.PI);
この時点で width, height, angle は、以下のようになります。
const width = lineLength;
const height = lineWidth;
const angle = lineAngle;
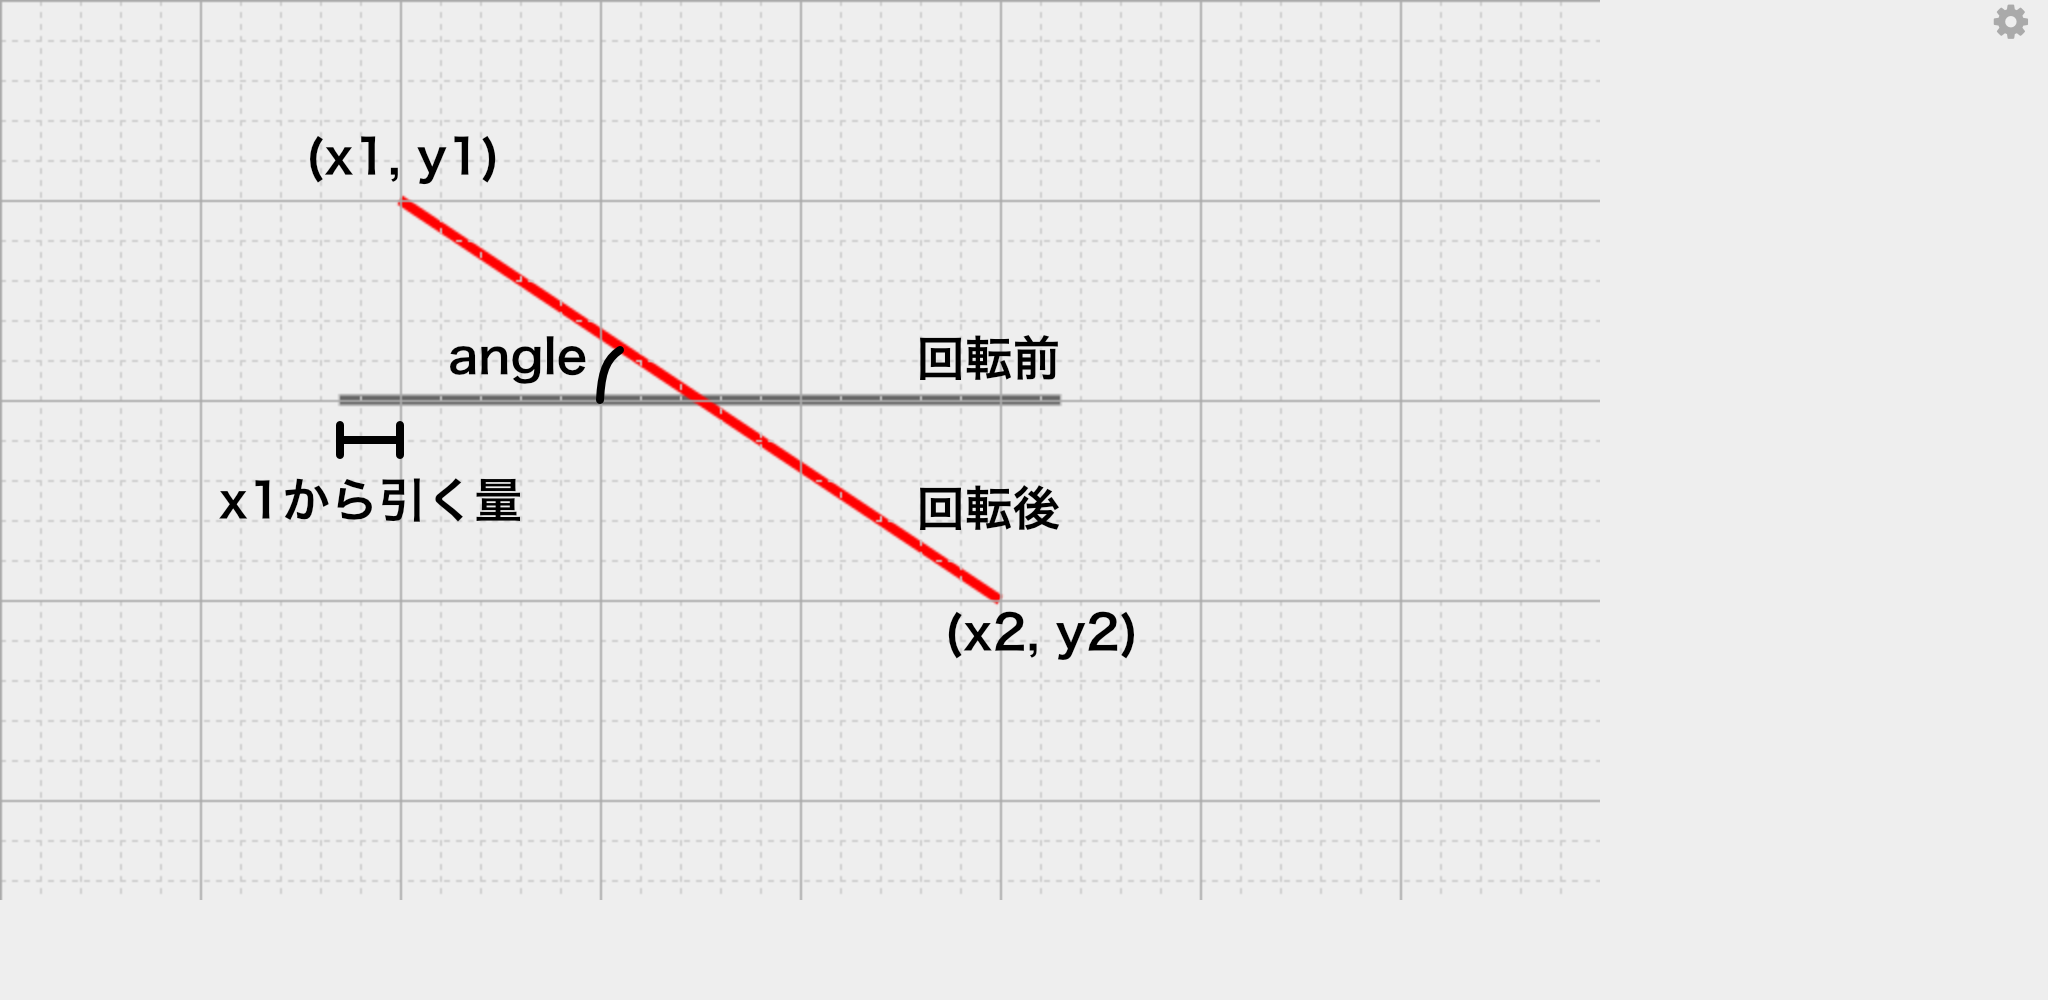
となります。問題は x と y の座標です。FilledRect は中心で回転するので回転後の座標を考えて座標を決める必要があります。具体的には以下のようになります。
const x = x1 - (lineLength / 2 - (x2 - x1) / 2);
const y = y1 - (lineWidth / 2 - (y2 - y1) / 2);
(x2 - x1) / 2 は矩形の中心のX座標です。lineLength / 2 からこの値を引くことで、x座標のずれを補正します。y座標も同様に計算します。図で表すと以下のようになります。
xとyは式を整理すると以下のようになります。
const x = (x2 + x1 - lineLength) / 2;
const y = (y2 + y1 - lineWidth) / 2;
これで線分が描画できます。以下のように x1, y1, x2, y2 を与えると、上の図の赤線が出来上がります。
const x1 = 200;
const y1 = 100;
const x2 = 500;
const y2 = 300;
デモとソースコード
以下のURLで実際に動くデモを試せます。
ソースコード全体は以下のリポジトリに置いてあります。


