「x, y, z 座標を適当に Matplotlib の関数に渡したらエラー吐いた」
誰もが通る道です。
以下のようにしてデータを変換しましょう。
import numpy as np
import matplotlib.pyplot as plt
from mpl_toolkits.mplot3d import Axes3D
from scipy.interpolate import griddata

# x, y, z をそれぞれ1次元配列やリストに格納してしまった!
x = []
y = []
z = []
for i in range(-10, 10):
    for j in range(-10, 10):
        x.append(j)
        y.append(i)
        z.append(i ** 2 + j ** 2)

# そのままプロットしようとしてエラー!
# plt.contourf(x, y, z)  # --> TypeError: Input z must be a 2D array.

# そういうときは、scipy.interpolate.griddata() でサンプリングしなおしましょう。
x_new, y_new = np.meshgrid(np.unique(x), np.unique(y))
z_new = griddata((x, y), z, (x_new, y_new))

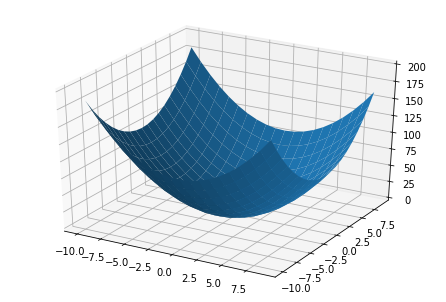
# これでちゃんと描画できます
ax = Axes3D(plt.figure())
ax.plot_surface(x_new, y_new, z_new)
plt.show()
x, y, z をそれぞれ2次元配列で用意できたら
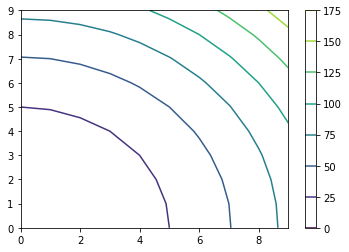
等高線
plt.contour(x, y, z)
plt.colorbar()
等高線を塗りつぶす
plt.contourf(x, y, z)
plt.colorbar()
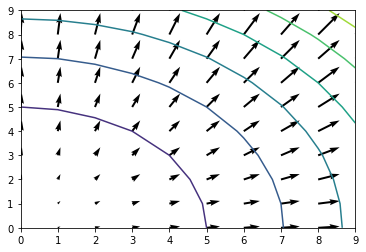
勾配
dx = np.c_[np.gradient(x)]
dy = np.c_[np.gradient(y)]
dz = np.c_[np.gradient(z)]
dz_dx, dz_dy = np.linalg.solve(np.c_[[dx, dy]].T, dz.T).T

plt.contour(x, y, z)
plt.quiver(x, y, dz_dx, dz_dy)
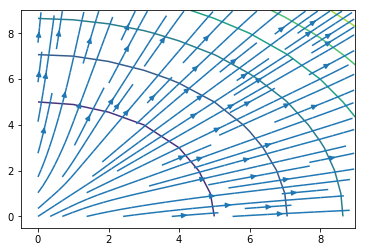
plt.contour(x, y, z)
plt.streamplot(x, y, dz_dx, dz_dy)
補足: 2変数関数をプロットするときに2次元配列が3つ必要な理由
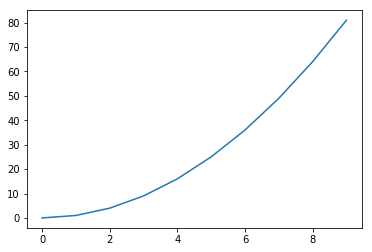
例えば、放物線の方程式 $y = x^2$ をプロットするとき、x 座標と y 座標を1次元配列で用意しますよね?
実はこれ、曲線上の点 $(x, y)$ を、次式のように配列の添字 i で媒介変数表示していることに相当します。
$$
\begin{cases}
x(i) = i \\
y(i) = i^2
\end{cases}
$$
import numpy as np
import matplotlib.pyplot as plt

x = np.empty([10])
y = np.empty([10])

for i in range(10):
    x[i] = i
    y[i] = i ** 2

plt.plot(x, y)
plt.show()
では、空間曲面を描画するときはどうするかというと、点 $(x, y, z)$ を2つの媒介変数 $i$ と $j$ で表現します。x, y, z をそれぞれ2次元配列で渡すのは、これが理由です。
$$
\begin{cases}
x(i, j) = j \\
y(i, j) = i \\
z(i, j) = i^2 + j^2
\end{cases}
$$
import numpy as np
import matplotlib.pyplot as plt

x = np.empty([10, 10])
y = np.empty([10, 10])
z = np.empty([10, 10])

for i in range(10):
    for j in range(10):
        x[i, j] = j
        y[i, j] = i
        z[i, j] = i ** 2 + j ** 2

plt.contourf(x, y, z)
plt.colorbar()
plt.show()
