30
29

Delete article

Deleted articles cannot be recovered.

Draft of this article would be also deleted.

Are you sure you want to delete this article?

More than 5 years have passed since last update.

chart.jsのグラフで軸のラベルを飛び飛びに表示する方法

Posted at

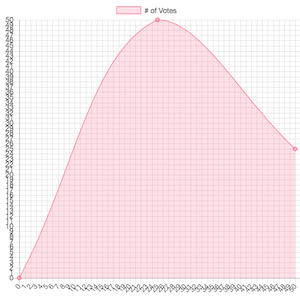
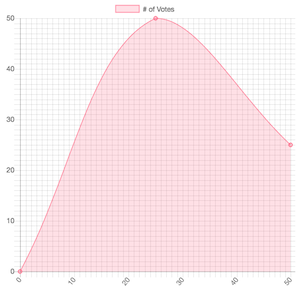
概要

これを
screencapture-file-Users-kytiken-develop-sandbox-javascript-chartjs-axis_callback_sample-index-html-1475905281791.png


こうしたい
screencapture-file-Users-kytiken-develop-sandbox-javascript-chartjs-axis_callback_sample-index-html-1475905544753.png

前提

このグラフのhtmlは下記のとおり

graph.html

<!DOCTYPE html>
<html lang="en">
<head>
  <meta charset="UTF-8">
  <title></title>
  <script src="https://ajax.googleapis.com/ajax/libs/jquery/3.1.1/jquery.min.js"></script>
  <script src="https://cdnjs.cloudflare.com/ajax/libs/Chart.js/2.3.0/Chart.bundle.min.js"></script>
</head>
<body>
  <div style="height: 500px; width: 500px;">
    <canvas id="myChart" width="400" height="400"></canvas>
  </div>
  <script>
    var ctx = document.getElementById("myChart");
    var myChart = new Chart(ctx, {
      type: 'line',
      data: {
        datasets: [{
          label: '# of Votes',
          data: [{
            x: 0,
            y: 0
          }, {
            x: 25,
            y: 50
          }, {
            x: 50,
            y: 25
          }],
          backgroundColor: 'rgba(255, 99, 132, 0.2)',
          borderColor: 'rgba(255,99,132,1)',
          borderWidth: 1
        }]
      },
      options: {
        scales: {
          xAxes: [{
            type: 'linear',
            position: 'bottom',
            ticks: {
              min: 0,
              max: 50,
              stepSize: 1
            }
          }],
          yAxes: [{
            ticks: {
              min: 0,
              max: 50,
              stepSize: 1
            }
          }]
        }
      }
    });
  </script>

</body>
</html>

方法

xAxesとyAxesのticksにcallbackを設定します

graph.html

(中略)
      options: {
        scales: {
          xAxes: [{
            type: 'linear',
            position: 'bottom',
            ticks: {
              callback: function(value) {return ((value % 10) == 0)? value : ''},
              min: 0,
              max: 50,
              stepSize: 1
            }
          }],
          yAxes: [{
            ticks: {
              callback: function(value) {return ((value % 10) == 0)? value : ''},
              min: 0,
              max: 50,
              stepSize: 1
            }
          }]
        }
      }
 (以下略)

今回のファイルをGistに置いておきます↓
https://gist.github.com/kytiken/8edf90a8c6355cbdde2555ef65133419

以上

参考

https://github.com/chartjs/Chart.js/issues/2121
http://www.chartjs.org/docs/
(Tick Configurationの項)
30
29
0

Register as a new user and use Qiita more conveniently

  1. You get articles that match your needs
  2. You can efficiently read back useful information
  3. You can use dark theme
What you can do with signing up
30
29

Delete article

Deleted articles cannot be recovered.

Draft of this article would be also deleted.

Are you sure you want to delete this article?