この記事は、Business Bank Group Developers Advent Calendar 10日目の記事です。
こんにちは、BBGの清水です。
おとといのアドベントカレンダーで、Pure JavaScript vs Lodashという内容を書きました。
せっかく計測したので、それをグラフで表示して可視化してみたいなー
Angular Materialさわってみたいなー
という思いを込めたアプリをAngularCLIで作ってみました。
開発環境
- Angular: 6.1.10
- Angular CLI: 6.1.5
- Angular Material: 7.1.1
実装
今回は、MatTableModuleを使用してタブ表示をしています。
また、グラフはNGX-CHARTSを使用しました。
開発環境に@angular/material, @swimlane/ngx-chartsを入れたら、必要なmoduleをapp.moduleにimportするだけで簡単にタブ・グラフ表示ができました。
import { BrowserAnimationsModule } from '@angular/platform-browser/animations';
import { MatTableModule, MatTabsModule, } from '@angular/material';
使う側はこんな感じです。
<div style="text-align:center">
  <h1>Pure JavaScript vs Lodash</h1>
</div>
<div class="body">
  <!-- Patternごとに結果をタブ切り替えで表示させた -->
  <mat-tab-group mat-align-tabs="start">
    <mat-tab label="Pattern1">
      <app-pattern1></app-pattern1>
    </mat-tab>
    <mat-tab label="Pattern2">
      <app-pattern2></app-pattern2>
    </mat-tab>
    <mat-tab label="Pattern3">
      <app-pattern3></app-pattern3>
    </mat-tab>
  </mat-tab-group>
</div>
<div class="wrapper">
  <div class="content">
    <button mat-stroked-button (click)="onClick()">
      StartMeasuring!
    </button>
    <ng-container *ngFor="let item of displayData">
      <div class="average">
        <span class="{{item.class}}">{{item.label}}</span>
        <span class="value">{{item.average}} (ms)</span>
      </div>
    </ng-container>
  </div>
  <!-- グラフ表示 -->
  <ngx-charts-line-chart
    [view]="view"
    [results]="inputData"
    [xAxis]="true"
    [yAxis]="true"
    [legend]="true"
    [showXAxisLabel]="true"
    [showYAxisLabel]="true"
    xAxisLabel="times"
    yAxisLabel="(ms)">
  </ngx-charts-line-chart>
</div>
import { Component } from '@angular/core';
import * as _ from 'lodash';

interface SeriesInterface {
  value: number;
  name: number;
}
interface InitialDataInterface {
  a: number;
}

@Component({
  selector: 'app-pattern1',
  templateUrl: './pattern1.component.html',
  styleUrls: ['./pattern1.component.css']
})

export class Pattern1Component {
  view = [750, 450];
  roopCount = 50;
  inputData: { name: 'PureJS' | 'Lodash', series: SeriesInterface[] }[] = [];
  displayData: { label: string, average: number, class: string }[] = [];

  constructor() {}

  onClick() {
    const data1: InitialDataInterface[] = [];
    const data2: InitialDataInterface[] = [];
    Array.from({ length: 10000 }, () => {
      const num = Math.random();
      data1.push({ a: num });
      data2.push({ a: num });
    });

    const result1: SeriesInterface[] = [];
    const result2: SeriesInterface[] = [];
    Array.from({ length: this.roopCount }, ({}, index) => {
      result1.push({ value: this.pureJS(data1), name: index });
      result2.push({ value: this.lodash(data2), name: index });
    });

    this.inputData = [ { name: 'PureJS', series: result1 }, { name: 'Lodash', series: result2 } ];
    this.inputData.forEach((item, i) => {
      this.displayData.push({
        label: `${item.name}Average: `,
        average: this.calcAverage(item.series),
        class: `label${i + 1}`,
      });
    });
  }

  calcAverage(result: SeriesInterface[]): number {
    return _.sum(result.map(o => o.value)) / this.roopCount;
  }

  pureJS(data: InitialDataInterface[]): number {
    const startMs = performance.now();
    let sum = 0;
    data.map(o => o.a)
      .filter(a => a % 2)
      .forEach(n => sum += n);
    return performance.now() - startMs;
  }

  lodash(data: InitialDataInterface[]): number {
    const startMs = performance.now();
    _.chain(data).map('a')
      .filter(a => a % 2).sum().value();
    return performance.now() - startMs;
  }
}
Angular Material はcomponentごとにstackblitzが用意されていて、ちょっとした動作確認やイメージを掴むのにとても便利でした。
MatTableModuleのタブ切り替えのUXがかっこよくて個人的にとても好きです。
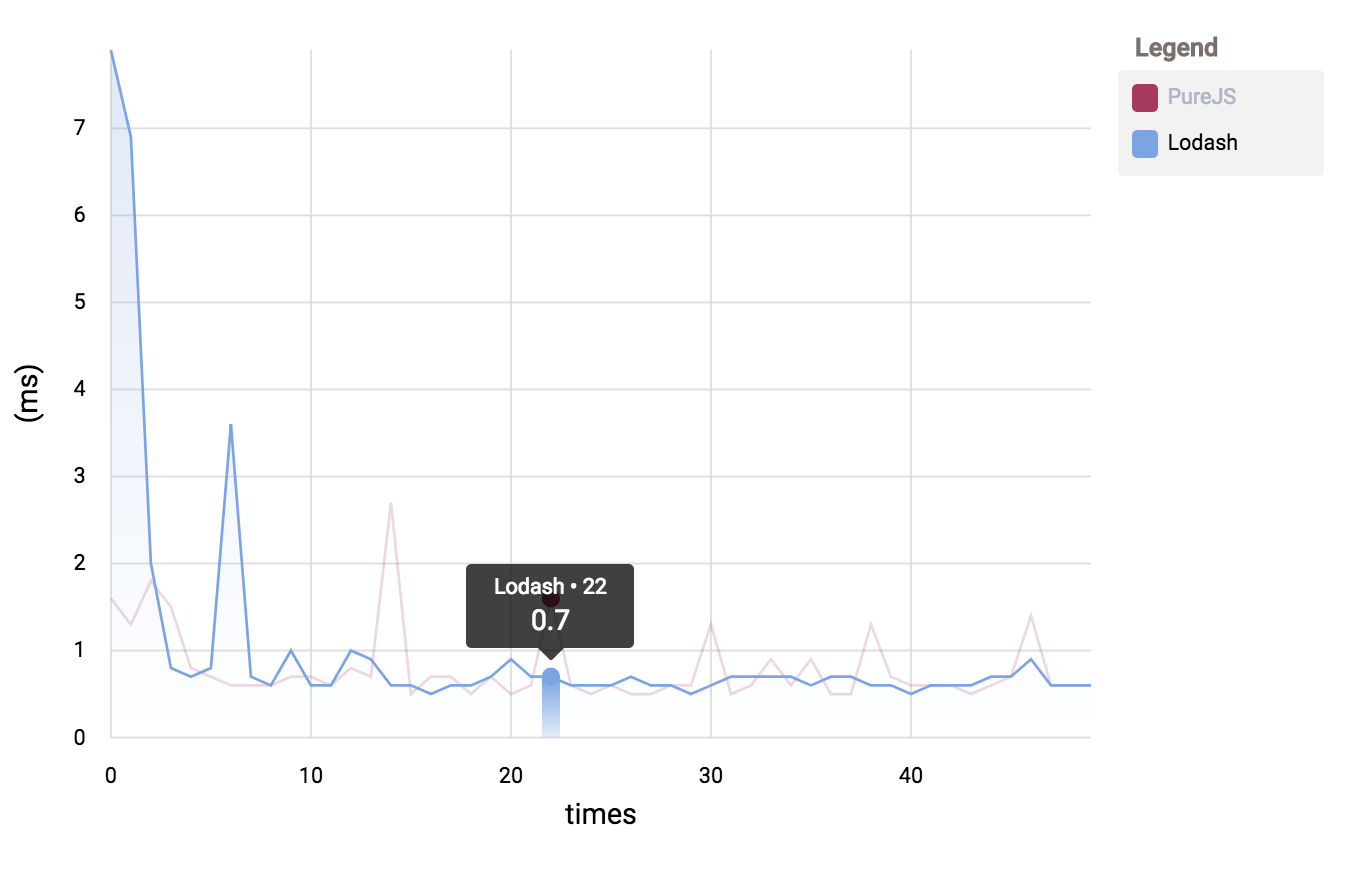
グラフは、NGX-CHARTSのLine Chartを使用しています。
グラフのマウスオーバー時の挙動はこんな感じです。

可視化の結果
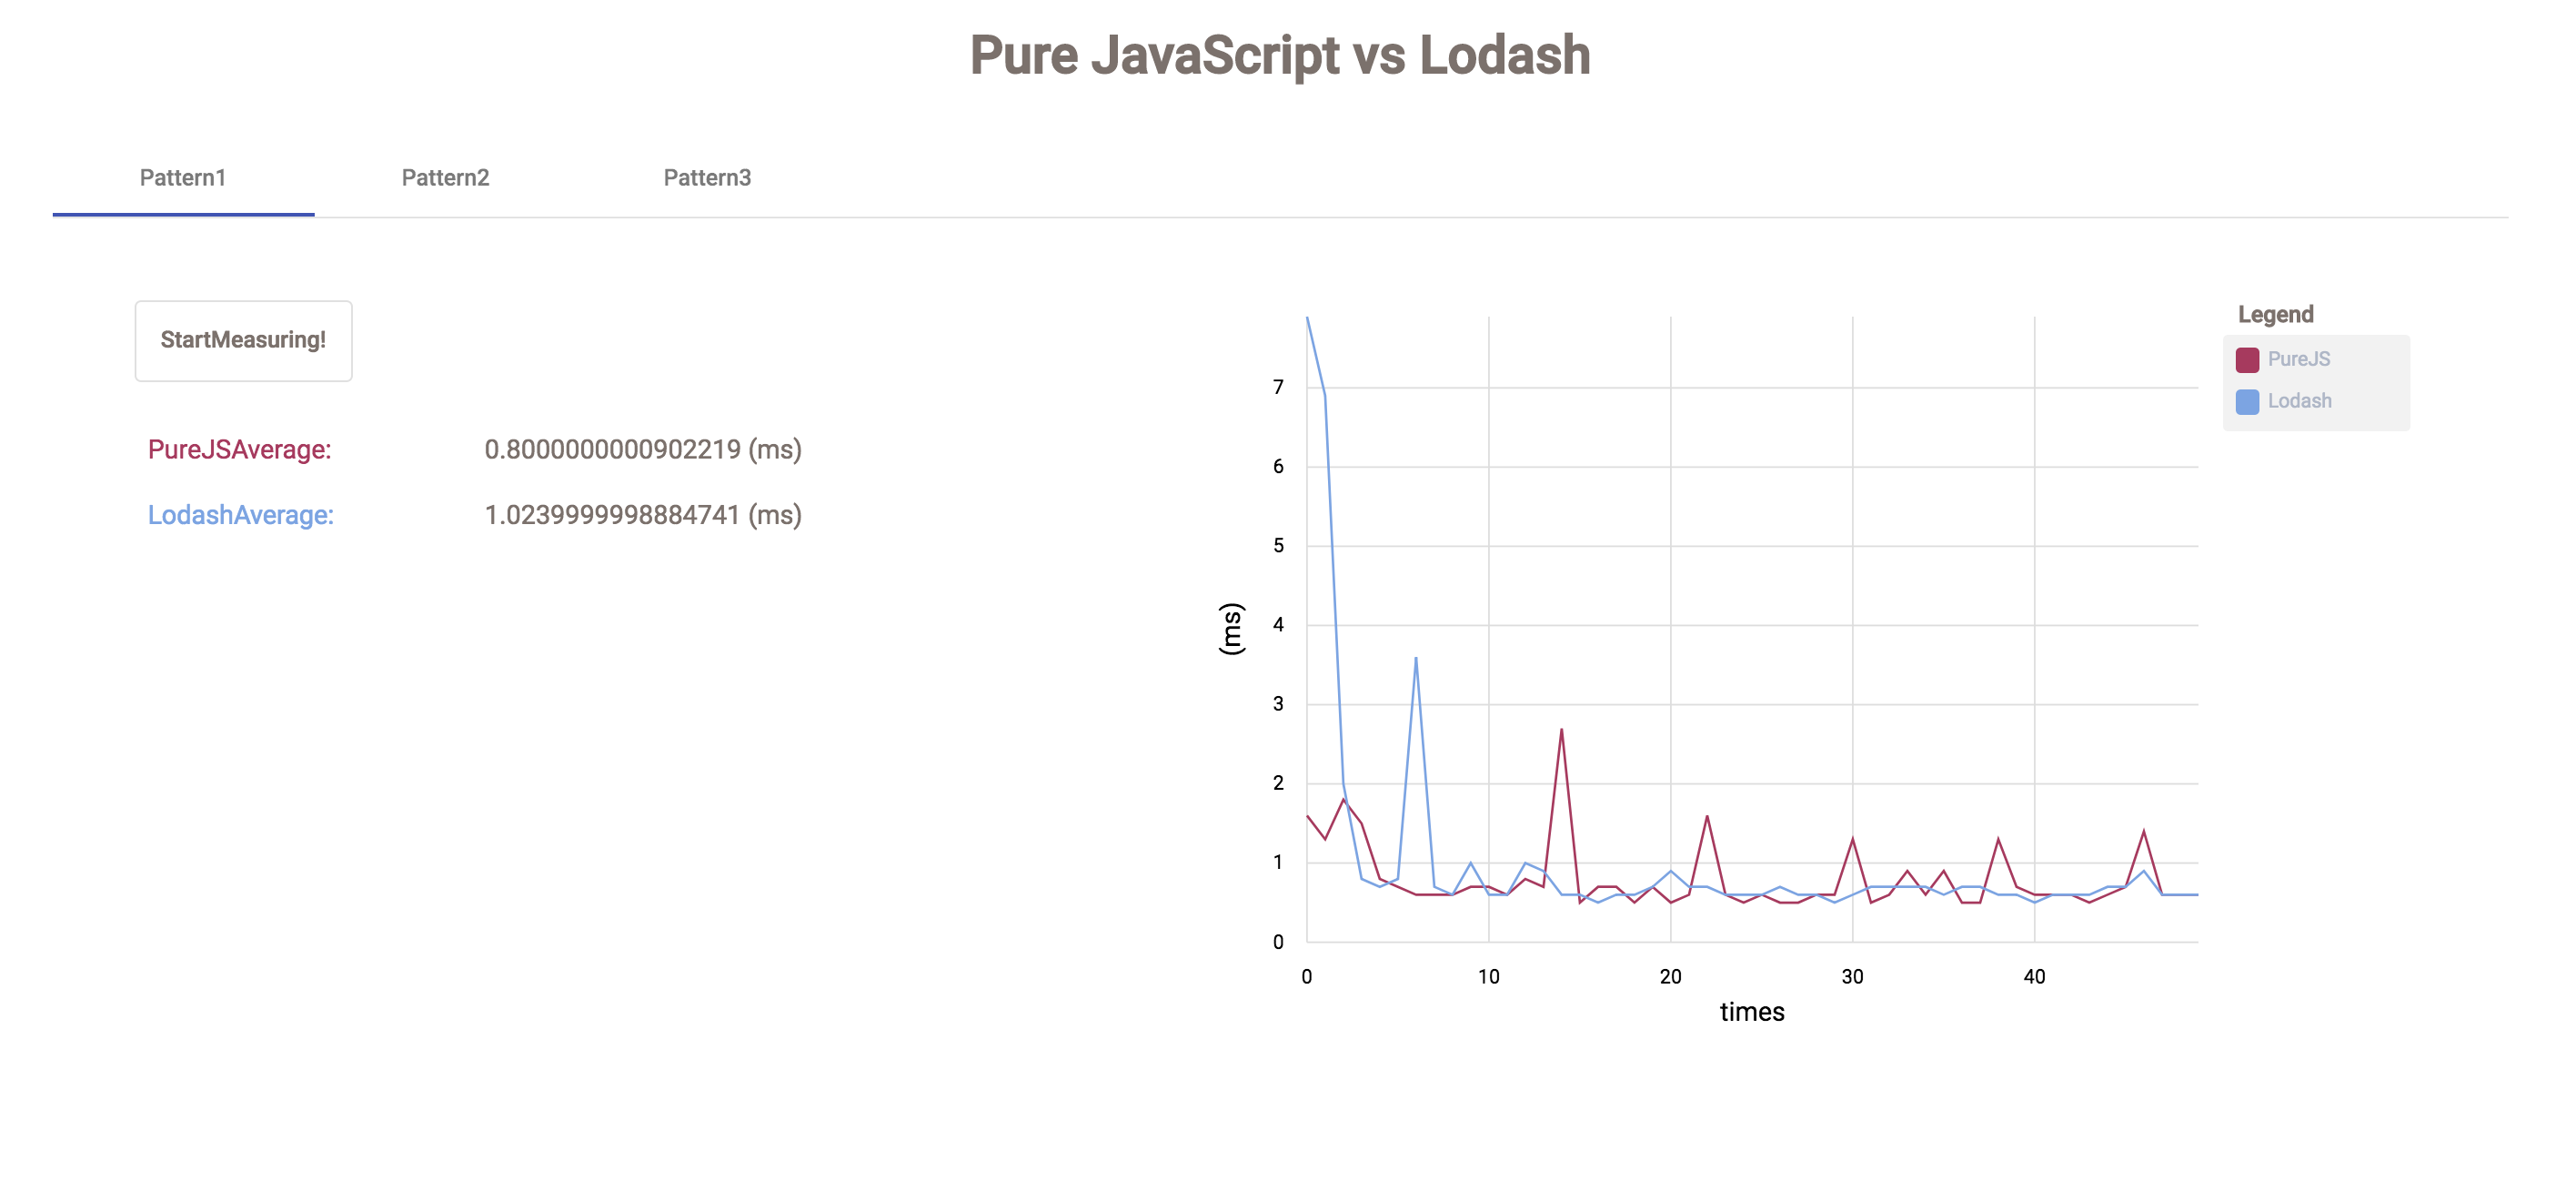
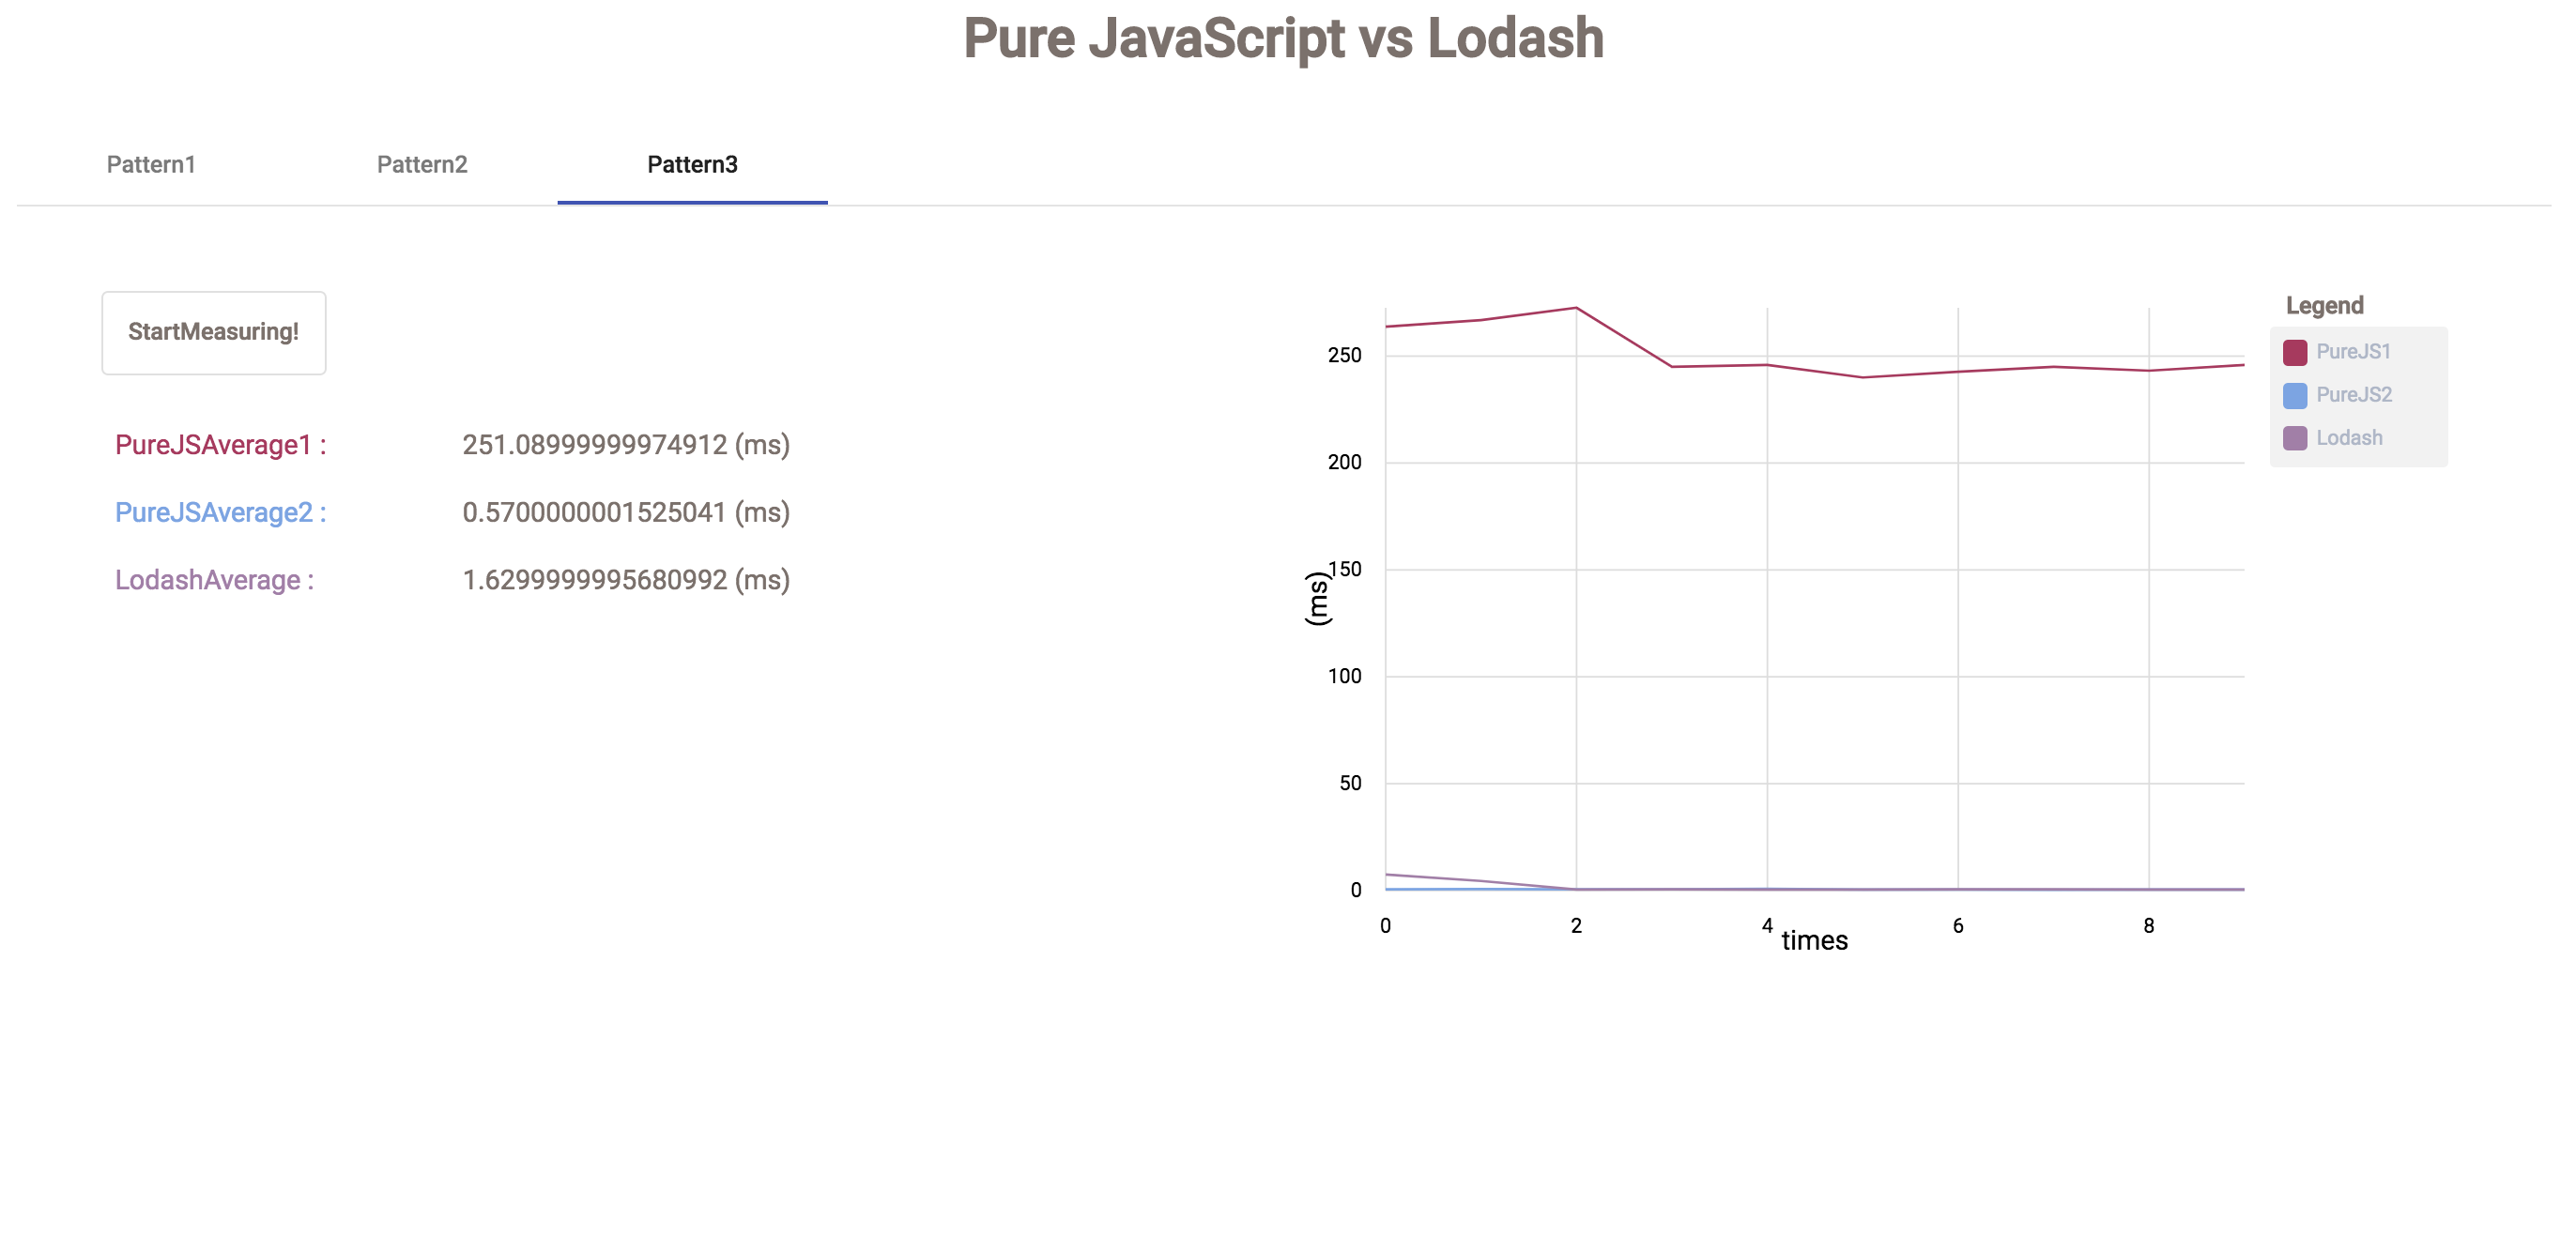
(グラフをみやすくするために、平均値はそれぞれ50, 50, 10回の結果を表示しています。)
Pattern 1
 平均値はPureJSが早いですが全体的に結果がまばらです。
あと、Lodashの最初の1回目に時間かかっているのが気になります。。(データの作り方が悪いのかな。。)
#### Pattern 2
 PureJSがLodashを上回ることは一度もなかったです。
#### Pattern 3
 前回の記事のコメントで[@pocke](https://qiita.com/pocke)さんが、PureJSのより良い実装を教えてくれたのでそちらのケースをPureJSAverage2として追加しています(ありがとうございます!)
その結果、処理の仕方によって計測結果が大きく変わることが分りました。(PureJSAverage1, PureJSAverage2)
さいごに
今回は、Angular CLIとNGX-CHARTSを使って簡単にデータを可視化することができました!
やはりグラフ化されるとデータが見やすくていいですね。以上です!
明日は、@keitatakahashiさんです。
お願いします!