使用環境:
window10
jupyternotebook
参考サイト:
キノコード / プログラミング学習チャンネル
Python学習の一環で、日経平均株価からデータ分析することをスタディしました。
備忘録としてアップしています。
日経平均日ごとの株価を取得します。panda datareaderというライブラリーを取得します。
これを使うと日経平均、ナスダック、日本の個別銘柄の株価を取得することができます。
!(イクスクラメーションマーク)を忘れないように。
! pip install pandas_datareader
インポートしたpandas_datareaderを使えるようにする。
from pandas_datareader import data
# pandasはデーター解析を支援するライブラリー データー集計、データー加工
# 1次元のデーターを扱う:Series, 2次元のデーターを扱うDataFrame
import pandas as pd
# グラフを書くためのライブラリー
import matplotlib.pyplot as plt
import numpy as np
# jupyterlabで作成したグラフを表示
%matplotlib inline
日経平均データー取得, start 取得する日を代入
start = '2019-06-01'
# 取得する最後の日
end = '2020-06-01'
# data:pandas datereaderの省略、第一引数:取得したいティッカーシンボル、第二引数:データーソースの名前、第三引数:取得したい期間
df = data.DataReader('^N225', 'yahoo', start,end)
# 上位10件表示
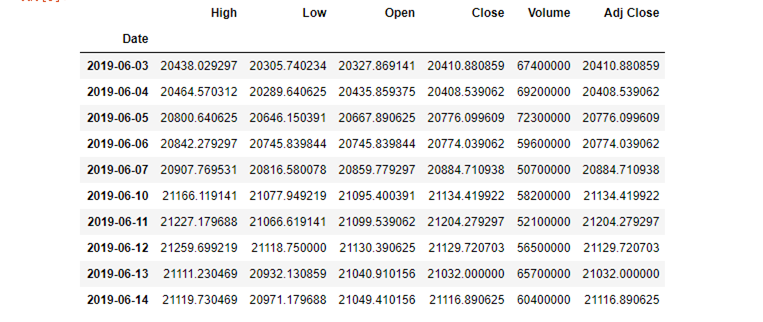
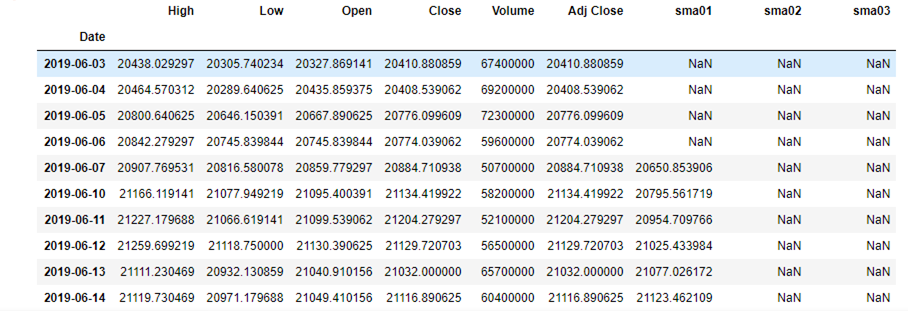
df.head(10)
インデックスの中身を見ていきます。
df.index
DatetimeIndexとして表示されています。この形だと時系列データとしても扱え、matplptlirで可視化にも便利です。
DatetimeIndex(['2019-06-03', '2019-06-04', '2019-06-05', '2019-06-06',
               '2019-06-07', '2019-06-10', '2019-06-11', '2019-06-12',
               '2019-06-13', '2019-06-14',
               ...
               '2020-05-19', '2020-05-20', '2020-05-21', '2020-05-22',
               '2020-05-25', '2020-05-26', '2020-05-27', '2020-05-28',
               '2020-05-29', '2020-06-01'],
              dtype='datetime64[ns]', name='Date', length=242, freq=None)
このdf.indexをdate変数に代入。Adj Closeはpriceという変数に代入します。
date=df.index
price=df['Adj Close']
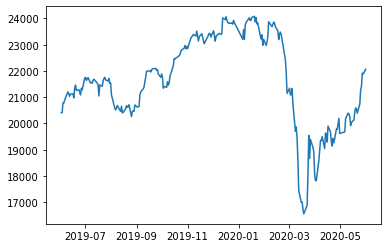
これをmatplotlibで可視化してみます。
# date=x軸。y軸
plt.plot(date,price)
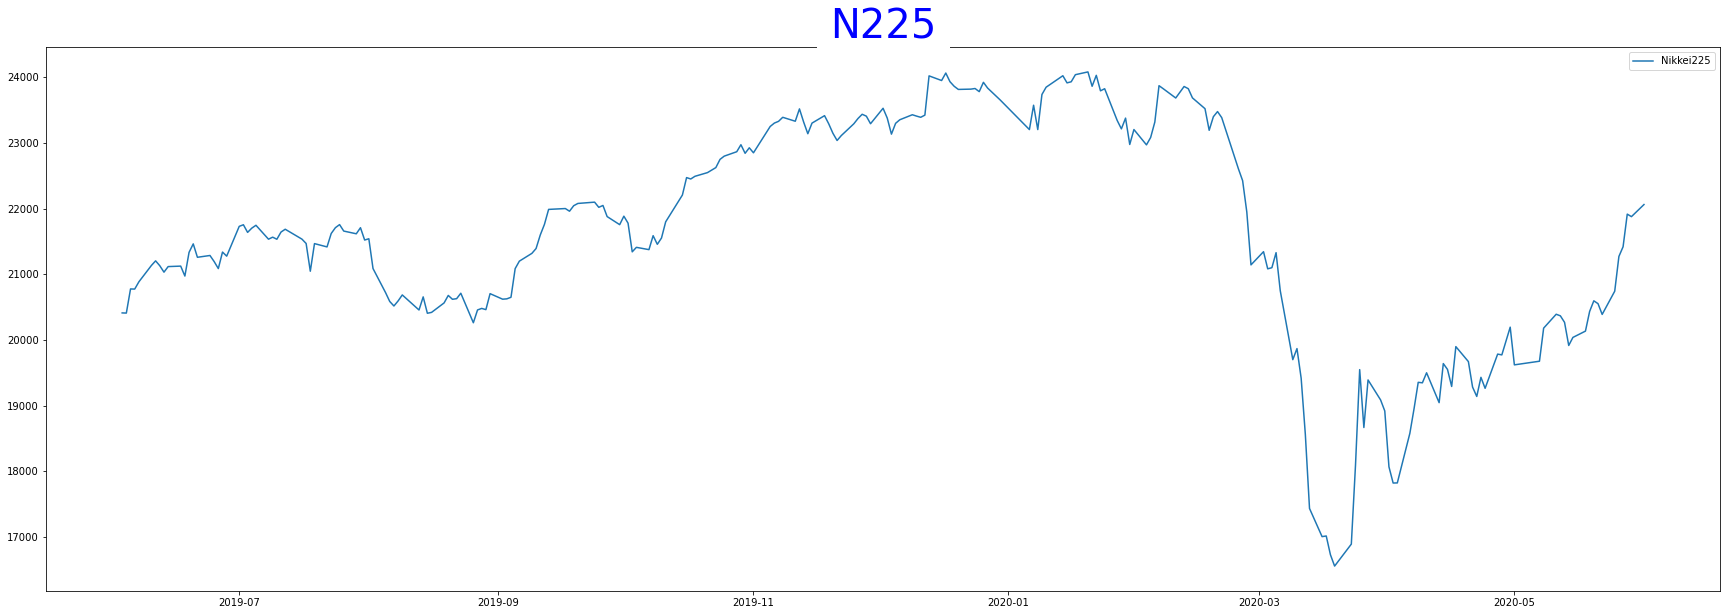
グラフが小さいので大きくします。30:横, 10: 縦
plt.figure(figsize=(30, 10))
# 凡例を付けます。labelの名前をNikkei225とする
plt.plot(date, price, label='Nikkei225')
# ラベルを表示するにはlegendが必要になります。
plt.legend()
グラフにタイトルを付けます。
plt.figure(figsize=(30, 10))
plt.plot(date, price, label='Nikkei225')
# グラフにタイトルを付けるplt.titleにする(第一:タイトル、第二:フォントカラー、第三:タイトル背景、第4:フォントサイズ、第五:タイトル位置
plt.title('N225', color='blue', backgroundcolor='white',size=40,loc='center')
plt.legend()
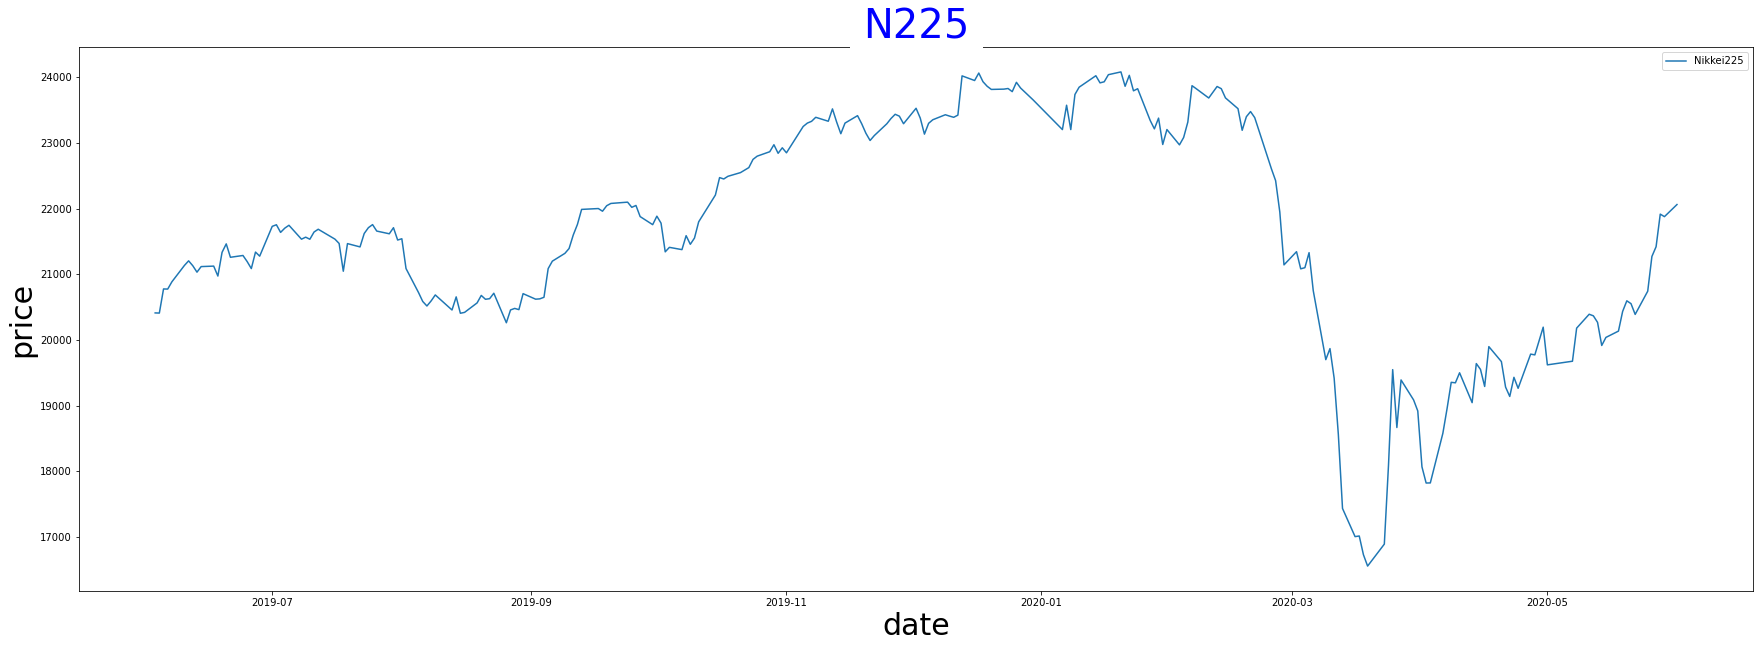
X軸とY軸の設定を行う。
plt.figure(figsize=(30, 10))
plt.plot(date, price, label='Nikkei225')
plt.title('N225', color='blue', backgroundcolor='white',size=40,loc='center')
# x軸、y軸の設定行う、x軸第一:x軸名前、第二:フォントカラー、第三:フォントサイズ
plt.xlabel('date',color='black',size=30)
plt.ylabel('price', color='black',size=30)
plt.legend()
いつ買っていつ売るかを検証する-移動平均を今までのグラフに追加
移動平均:過去○○日分の平均
# 移動平均の期間5日間、25日間、50日間の移動平均
span01=5
span02=25
span03=50
# 移動平均算出には、rollingメソッド使う。窓関数を適用できるサンプリングの間隔を指定できる
# データーフレームから一列取り出したprice,window:間隔、平均の意味mean使う。max() その区間の最大値 min()最小値
df['sma01']=price.rolling(window=span01).mean()
df['sma02']=price.rolling(window=span02).mean()
df['sma03']=price.rolling(window=span03).mean()
pd.set_option('display.max_rows', None)
df.head(100)
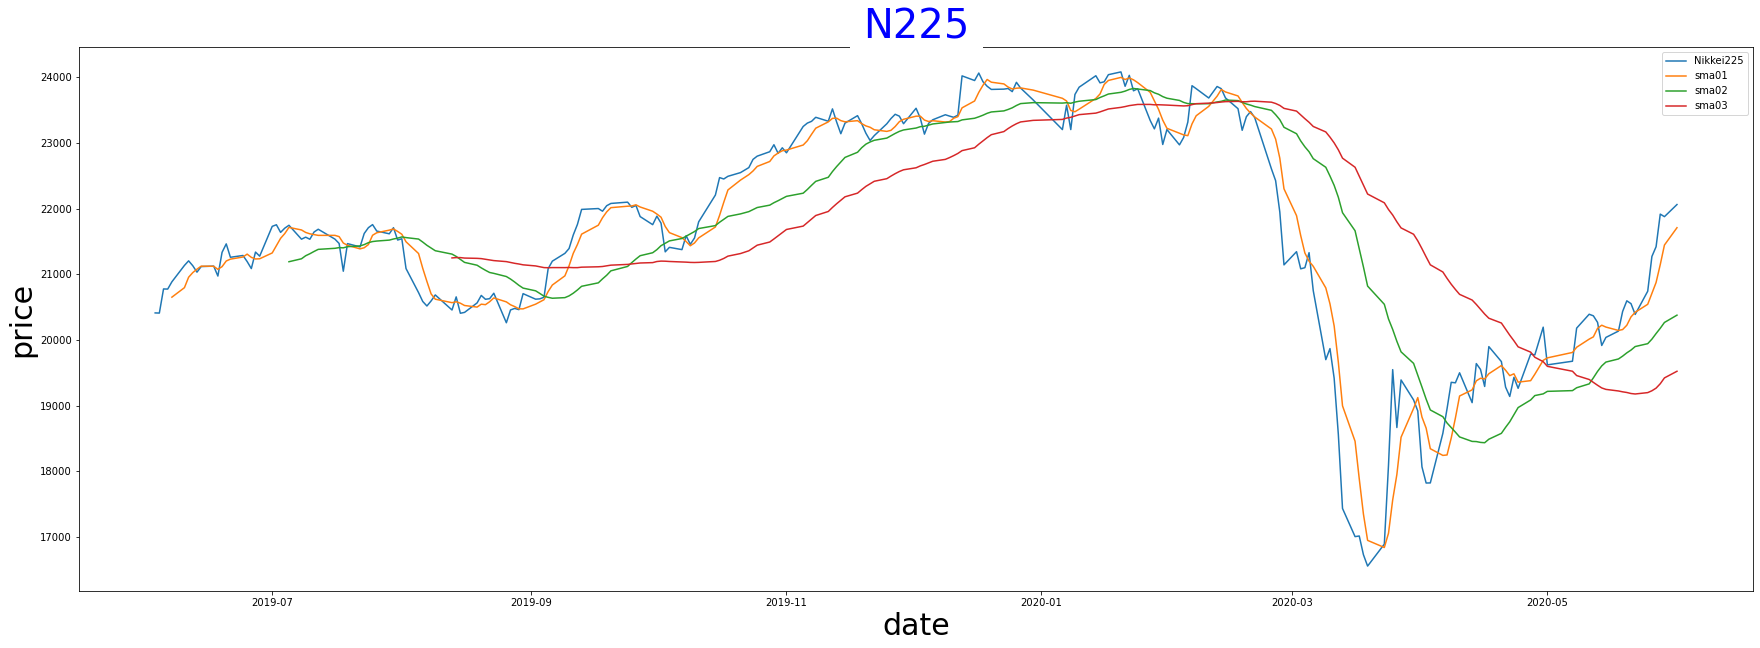
移動平均を今までのグラフに追加します。
plt.figure(figsize=(30, 10))
plt.plot(date, price, label='Nikkei225')

plt.plot(date,df['sma01'],label='sma01')
plt.plot(date,df['sma02'],label='sma02')
plt.plot(date,df['sma03'],label='sma03')

plt.title('N225', color='blue', backgroundcolor='white',size=40,loc='center')
plt.xlabel('date',color='black',size=30)
plt.ylabel('price', color='black',size=30)
plt.legend()
https://colorhunt.co/pallette/184189
色をRGBで指定することができます。上記サイト参考web
plt.figure(figsize=(30, 10))
plt.plot(date, price, label='Nikkei225',color='#99b898')

plt.plot(date,df['sma01'],label='sma01',color='#e84a5f')
plt.plot(date,df['sma02'],label='sma02',color='#ff847c')
plt.plot(date,df['sma03'],label='sma03',color='#feceab')

plt.title('N225', color='blue', backgroundcolor='white',size=40,loc='center')
plt.xlabel('date',color='black',size=30)
plt.ylabel('price', color='black',size=30)
plt.legend()
いつ買っていつ売ればよかったか分析:
ゴールデンクロス:短期移動平均線が中期以上の移動平均線を下から上に抜ける。価格上昇サイン
デッドクロス分析:短期移動平均線が中期以上の移動平均線を上から下に抜けること。価格が下降するサイン
棒グラフを作ります。
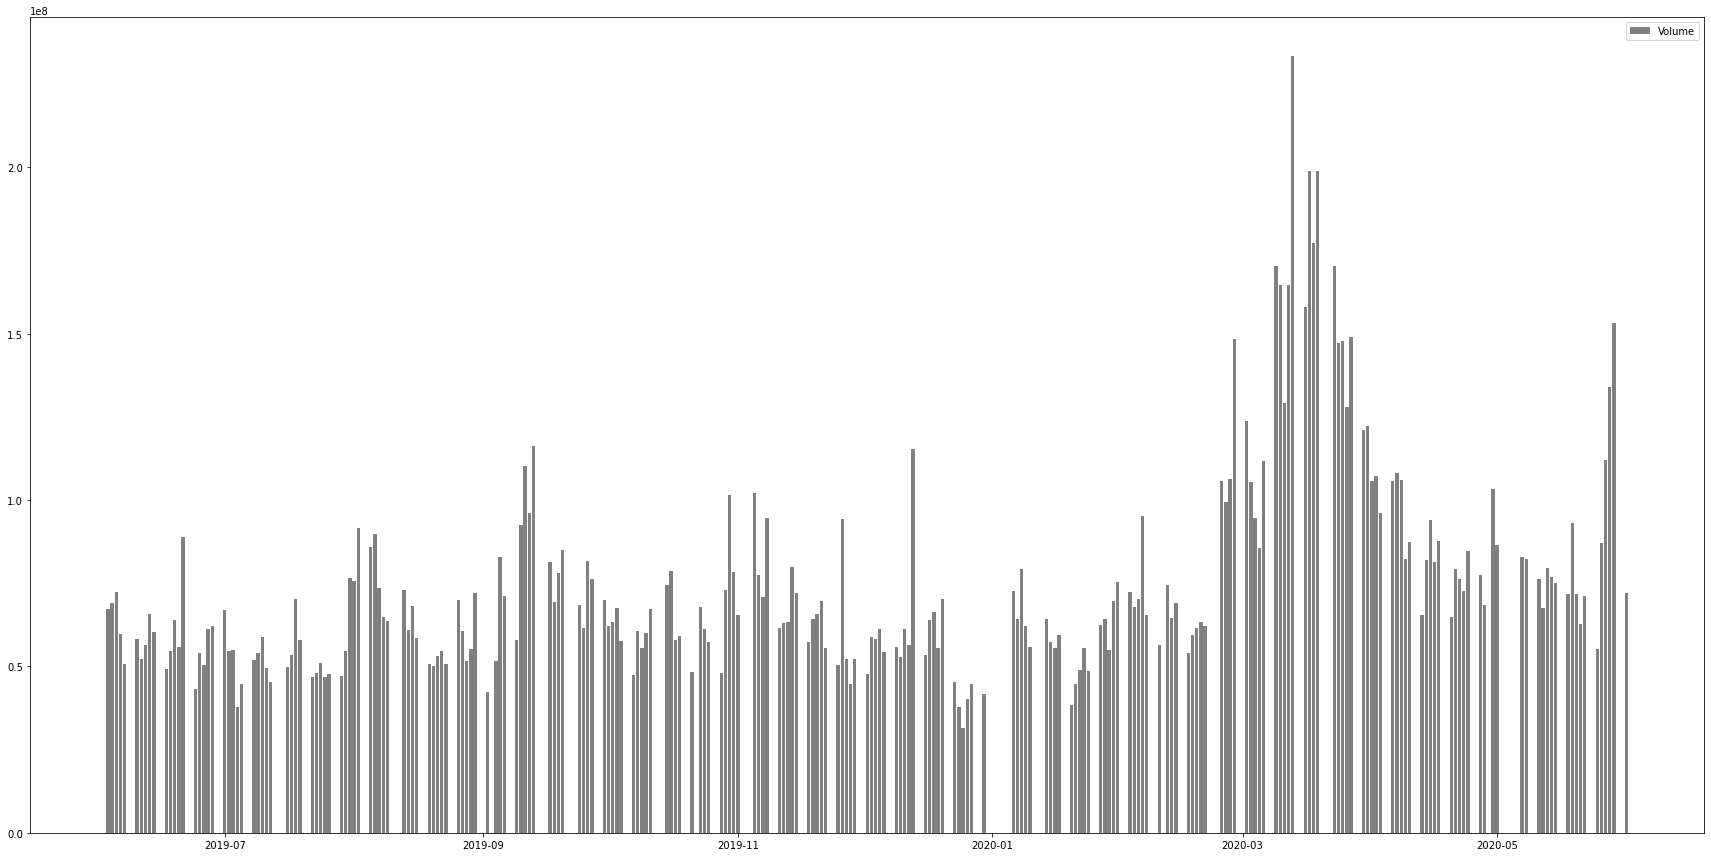
出来高を示す為、棒グラフを作成。
plt.figure(figsize=(30,15))
棒グラフの場合、barです。第一:date, 第二:dfの中のvolume, 第三:ラベル名、第4:色
plt.bar(date,df['Volume'],label='Volume', color='grey')
plt.legend()
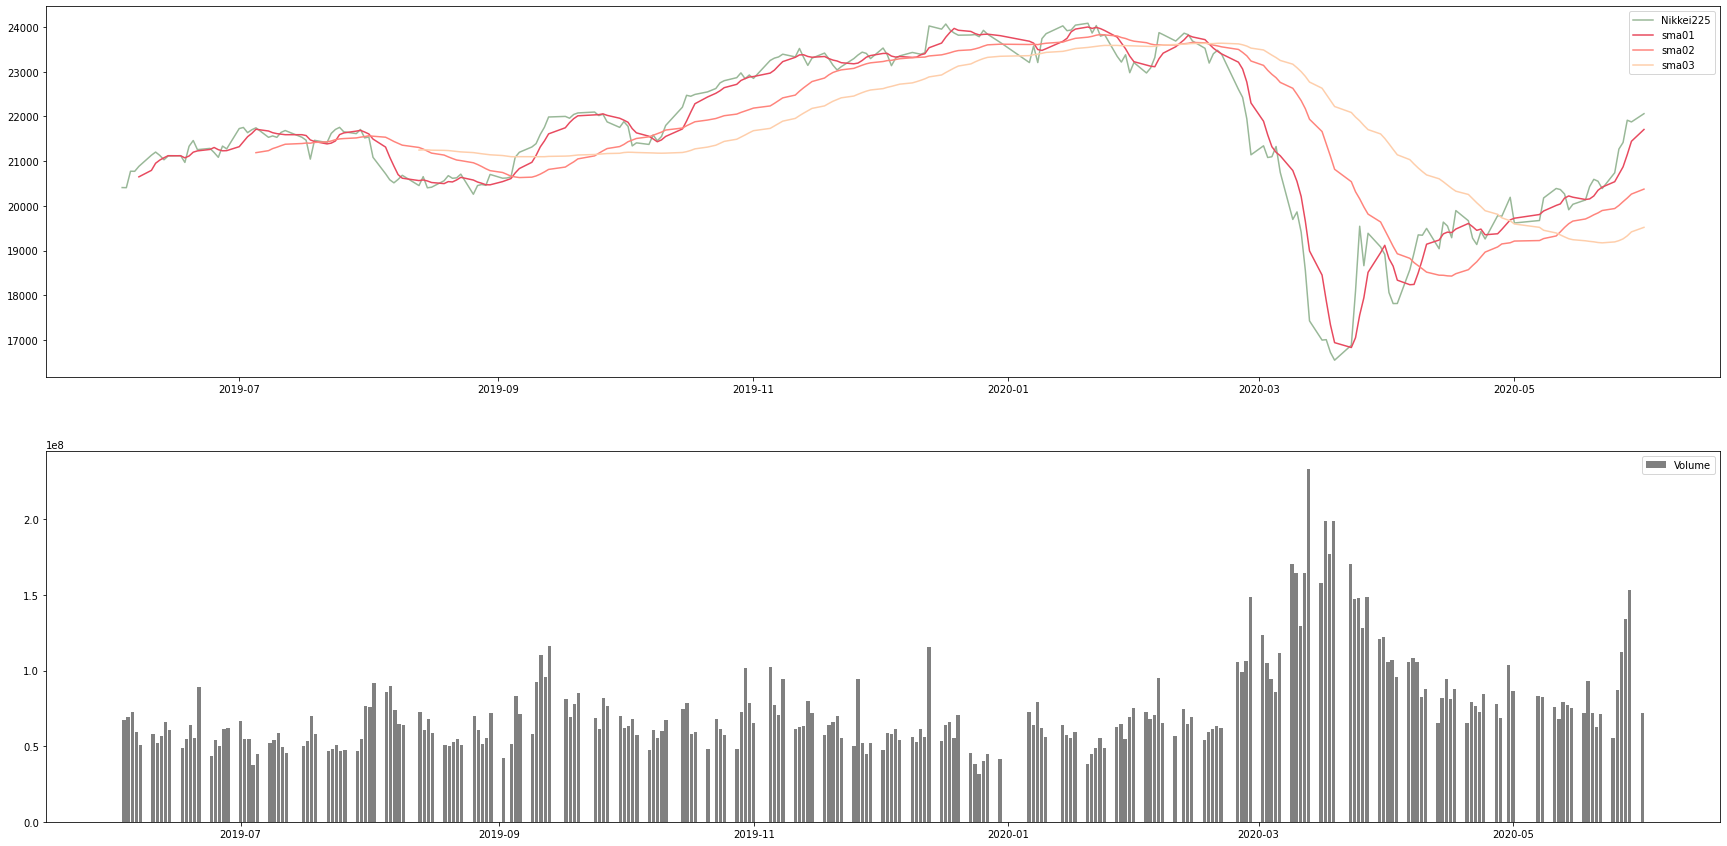
棒グラフと線グラフを2つ表示
plt.figure(figsize=(30,15))
# サブプロット関数使用(縦方向を分割する数(今回は上下2つなので2、横方向一列で表示したいので一列、グラフの配置)
plt.subplot(2,1,1)
# セングラフの記述
plt.plot(date, price, label='Nikkei225',color='#99b898')
plt.plot(date,df['sma01'],label='sma01',color='#e84a5f')
plt.plot(date,df['sma02'],label='sma02',color='#ff847c')
plt.plot(date,df['sma03'],label='sma03',color='#feceab')
plt.legend()
# 棒グラフ(第3 2は2番目に位置)
plt.subplot(2,1,2)
plt.bar(date,df['Volume'],label='Volume',color='grey')
plt.legend()
次に、個別銘柄の株価を取得します。例えば、リクルートの株価を取得する為には、東京証券取引所サイトへ行き、会社名入力。リクルートホールディングスの証券コード確認(6098)し、DataReaderにて取得する。
# 第一:証券コード(6098)、第二:データーソース
df = data.DataReader('6098.JP','stooq')
df.head() 上位5つの情報を取得。
	Open	High	Low	Close	Volume
Date
2021-04-22	5000.0	5071.0	4984.0	5071.0	2690900
2021-04-21	4920.0	4958.0	4857.0	4895.0	3147900
2021-04-20	4958.0	5015.0	4941.0	5008.0	3422000
2021-04-19	5110.0	5164.0	5028.0	5035.0	3307800
2021-04-16	5186.0	5210.0	5097.0	5114.0	3141400
最安値を求めます。
df.index.min()
Timestamp('2016-04-26 00:00:00')
最高値を求めます。
df.index.max()
Timestamp('2021-04-22 00:00:00')
上記のdfでは、新しい順に並んでいるので、古い順に要素変えたい場合は,sort_valuesで変換、インデックスの場合はsort_index()で変換。
# データフレームのインデックス並び替え
df = df.sort_index()
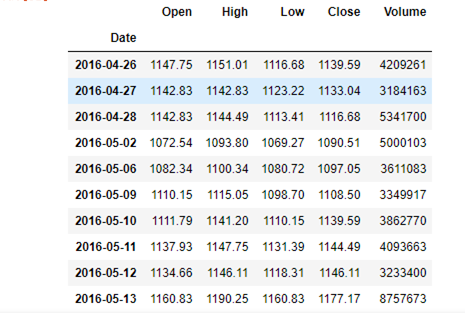
日付け古い順に変換されました。
	Open	High	Low	Close	Volume
Date
2016-04-26	1147.75	1151.01	1116.68	1139.59	4209261
2016-04-27	1142.83	1142.83	1123.22	1133.04	3184163
2016-04-28	1142.83	1144.49	1113.41	1116.68	5341700
2016-05-02	1072.54	1093.80	1069.27	1090.51	5000103
2016-05-06	1082.34	1100.34	1080.72	1097.05	3611083
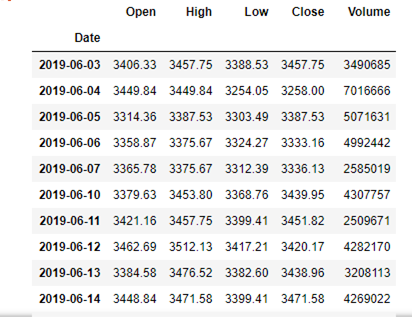
次に日にちを絞ったやり方は下記になります。2019年6月1日から2020年5月1日とします。
df.index>='2019-06-01 00:00:00'
上記をデータフレームの中に入れます。
df[df.index>='2019-06-01 00:00:00']
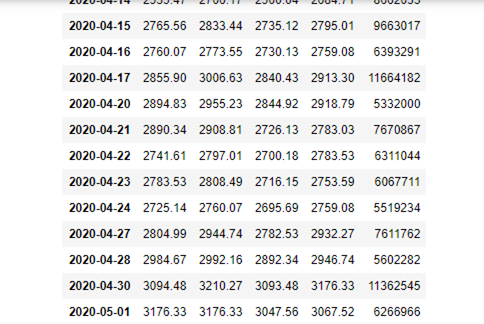
2020年5月1日以下株価取得します。
df[df.index<='2020-05-01 00:00:00']
以上から2019年6月1日から2020年5月1日までの株価を取得します。
df[(df.index>='2019-06-01 00:00:00')&(df.index<='2020-05-01 00:00:00')]
2019年6月1日から2020年5月1日の株価が取得出来ています。
# リクルートホールディングス株価を可視化してみる。
日付けを変数start, endに入れ、銘柄情報もcompany codeの変数に変換。それを下のコードに編入してみる。
# df[(df.index>=start)&(df.index<=end)]
# df = data.DataReader('6098.JP','stooq')

start = '2019-06-01'
end = '2020-05-01'
company_code = '6502.JP'

df[(df.index>=start)&(df.index<=end)]
df = data.DataReader('6098.JP','stooq')

date=df.index
price=df['Close']

span01=5
span02=25
span03=50

df['sma01']=price.rolling(window=span01).mean()
df['sma02']=price.rolling(window=span02).mean()
df['sma03']=price.rolling(window=span03).mean()

plt.figure(figsize=(30,15))
plt.subplot(2,1,1)

plt.plot(date, price, label='Close',color='#99b898')
plt.plot(date,df['sma01'],label='sma01',color='#e84a5f')
plt.plot(date,df['sma02'],label='sma02',color='#ff847c')
plt.plot(date,df['sma03'],label='sma03',color='#feceab')
plt.legend()

plt.subplot(2,1,2)
plt.bar(date,df['Volume'],label='Volume',color='grey')
plt.legend()
更にどの銘柄でもある一定期間の株価を確認し、比較できるように関数にすれば、簡単に株価を取得できる。
# company_stock関数を作り、引数をstart, end, compnay_codeに設定。
def company_stock (start,end,company_code):
    df = data.DataReader(company_code, 'stooq')
    df = df[(df.index>=start)&(df.index<=end)]

    date = df.index
    price = df['Close']

    span01=5
    span02=25
    span03=50

    df['sma01']=price.rolling(window=span01).mean()
    df['sma02']=price.rolling(window=span02).mean()
    df['sma03']=price.rolling(window=span03).mean()

    plt.figure(figsize=(20,10))
    plt.subplot(2,1,1)

    plt.plot(date, price, label='Close',color='#99b898')
    plt.plot(date,df['sma01'],label='sma01',color='#e84a5f')
    plt.plot(date,df['sma02'],label='sma02',color='#ff847c')
    plt.plot(date,df['sma03'],label='sma03',color='#feceab')
    plt.legend()

    plt.subplot(2,1,2)
    plt.bar(date,df['Volume'],label='Volume',color='grey')
    plt.legend()
関数実行、呼び出すには関数名に引数を渡して実行します。
company_stock('2017-06-01','2020-06-01','6502.JP')
以上、株価銘柄のデータ分析をトライしてみました。今度は、違った分析も取り入れ、チャレンジしたいと思います。
