はじめに
みなさま、日頃Githubに草は生やしていますか?
実はあれ、正式名称は「ヒートマップ」と呼ぶらしいです。
今回の実装をするときに初めて知りました。。
ちなみに、みたことない方はいないと思いますがこのようなものです
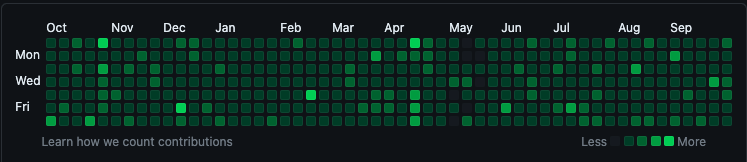
Githubは、「コントリビューション(貢献)」単位で草が生えます。
コミットやプッシュ回数も一つのカウントですが、コードレビューやプルリクエストのマージなどもその対象となり、1日の中でその回数が多いほど色が濃くなる仕組みです。
今回は、このヒートマップの簡易バージョンをFlutterで作ってみようと思い実装をしてみました
デモ動画
表示状態
セルのロングタップ時

使い方
極力簡易的に使えるようにしています(手を抜いただけ)
以下のパラメーターが指定できます
- data:日付データ一覧
List<Map<DateTime, int>>で日付単位のスコア一覧を渡します - colorSet:色付けの定義をします。
List<Map<int, Color>>で基準値とそれを超えた時の色を定義できます - defaultColor: スコア0のセルの色を定義できます
- cellSize:1つのセルの色を指定できます
- targetYear:年度の切り替えができるようにしています。別途
TextButtonなど用意するのもいいですね
Heatmap(
  data: [
    // テストデータ
    {DateTime(2023, 1, 1): 1},
    {DateTime(2022, 1, 2): 2},
    {DateTime(2022, 1, 3): 3},
    {DateTime(2023, 1, 4): 4},
    {DateTime(2023, 1, 5): 5},
    // 3月中旬データ
    {DateTime(2023, 3, 1): 1},
    {DateTime(2023, 3, 2): 2},
    {DateTime(2023, 3, 3): 3},
    {DateTime(2023, 3, 4): 4},
    {DateTime(2023, 3, 5): 5},
    {DateTime(2022, 3, 6): 1},
    {DateTime(2022, 3, 7): 2},
    {DateTime(2022, 3, 8): 3},
    {DateTime(2022, 3, 9): 4},
    {DateTime(2022, 3, 10): 5},
    // 5月データ
    {DateTime(2023, 5, 1): 5},
    {DateTime(2023, 5, 2): 3},
    {DateTime(2023, 5, 3): 2},
    {DateTime(2023, 5, 4): 4},
    {DateTime(2023, 5, 5): 1},
    // 8月データ
    {DateTime(2023, 8, 1): 5},
    {DateTime(2023, 8, 2): 10},
    {DateTime(2023, 8, 3): 6},
    {DateTime(2023, 8, 4): 4},
    // 12月データ
    {DateTime(2023, 12, 1): 1},
    {DateTime(2023, 12, 2): 10},
    {DateTime(2023, 12, 3): 4},
    {DateTime(2023, 12, 4): 10},
    // ... 他のデータ
  ],
  colorSet: const {
    1: Color(0xFFD7ECBF),
    3: Color(0xFFB3E778),
    5: Color(0xFF239C27),
    10: Color(0xFF027C06),
  },
  cellSize: 14,
  targetYear: 2023,
),
コード全体
今回は、パッケージなしでCustomPainterなどで作り切りました。
パラメーター含め、好きにカスタムして使っていただければと思います。
import 'package:flutter/material.dart';

/// `Heatmap` ウィジェットは日時データに基づいてヒートマップを表示します。
///
/// - [data]: ヒートマップのデータ。heat
/// - [colorSet]: 値ごとの色セット。
/// - [cellSize]: 各セルのサイズ。
/// - [defaultColor]: デフォルトのセル色。
/// - [targetYear]: ヒートマップの対象年。
///
class Heatmap extends StatefulWidget {
  const Heatmap({
    required this.data,
    required this.colorSet,
    super.key,
    this.cellSize = 16.0,
    this.defaultColor,
    this.targetYear,
  });
  final List<Map<DateTime, int>> data;
  final Map<int, Color> colorSet;
  final double cellSize;
  final Color? defaultColor;
  final int? targetYear;

  @override
  _HeatmapState createState() => _HeatmapState();
}

class _HeatmapState extends State<Heatmap> {
  DateTime? _selectedDate;
  late OverlayEntry _overlayEntry;

  @override
  Widget build(BuildContext context) {
    return SingleChildScrollView(
      scrollDirection: Axis.horizontal,
      child: GestureDetector(
        onLongPress: () {
          // PopupMenuを表示
          _showPopupMenu(context);
        },
        onLongPressUp: () {
          if (_overlayEntry.mounted) {
            _overlayEntry.remove();
          }
        },
        child: SizedBox(
          height: (widget.cellSize * 7),
          child: CustomPaint(
            painter: HeatmapPainter(
              data: widget.data,
              colorSet: widget.colorSet,
              cellSize: widget.cellSize,
              targetYear: widget.targetYear,
              onTapCell: (date) {
                setState(() {
                  _selectedDate = date;
                });
              },
            ),
            size: Size(widget.cellSize * (365 ~/ 7), (widget.cellSize * 7)),
          ),
        ),
      ),
    );
  }

  void _showPopupMenu(BuildContext context) {
    if (_selectedDate == null) return;

    final overlay = Overlay.of(context);
    final overlayPosition = OverlayEntry(
      builder: (context) => Positioned(
        top: 140, // 位置は適切に調整してください。
        left: MediaQuery.sizeOf(context).width * 0.4, // 位置は適切に調整してください。
        child: Material(
          child: Container(
            padding: const EdgeInsets.symmetric(vertical: 4, horizontal: 8),
            decoration: BoxDecoration(
              color: Colors.white,
              borderRadius: BorderRadius.circular(4),
              boxShadow: const [
                BoxShadow(
                  color: Colors.black12,
                  offset: Offset(0, 2),
                  blurRadius: 6,
                ),
              ],
            ),
            child: Center(
              child: Text(
                _selectedDate!.toLocal().toIso8601String().split('T').first,
                style: const TextStyle(fontSize: 12),
              ),
            ),
          ),
        ),
      ),
    );

    overlay.insert(overlayPosition);
    _overlayEntry = overlayPosition;
  }
}

/// `HeatmapPainter` クラスは、ヒートマップのカスタム描画を行います。
///
/// - [data]: ヒートマップのデータ。
/// - [colorSet]: 値ごとの色セット。
/// - [cellSize]: 各セルのサイズ。
/// - [onTapCell]: セルがタップされたときのコールバック。
/// - [defaultColor]: デフォルトのセル色。
/// - [targetYear]: ヒートマップの対象年。
///
class HeatmapPainter extends CustomPainter {
  HeatmapPainter({
    required this.data,
    this.colorSet = const {},
    this.cellSize = 16.0,
    this.onTapCell,
    this.defaultColor,
    this.targetYear,
  });

  final List<Map<DateTime, int>> data;
  final Map<int, Color> colorSet;
  final double cellSize;
  final void Function(DateTime date)? onTapCell;
  final Color? defaultColor;
  final int? targetYear;

  @override
  bool? hitTest(Offset position) {
    // セルの位置を計算
    final week = (position.dx ~/ cellSize).toInt();
    final day = (position.dy ~/ cellSize).toInt();

    final targetYearNumber = targetYear ?? DateTime.now().year;

    final selectedDate =
        DateTime(targetYearNumber, 1, 1).add(Duration(days: (week * 7) + day));
    if (onTapCell != null) {
      onTapCell!(selectedDate);
    }

    return super.hitTest(position);
  }

  Color _getColorFromSet(int value) {
    final thresholds = colorSet.keys.toList()..sort();
    for (final threshold in thresholds) {
      if (value <= threshold) {
        return colorSet[threshold]!;
      }
    }
    return defaultColor ?? Colors.grey[300]!;
  }

  @override
  void paint(Canvas canvas, Size size) {
    const borderThickness = 0.5;

    final targetYearNumber = targetYear ?? DateTime.now().year;

    final currentYearStartDate = DateTime(targetYearNumber, 1, 1);

    // Filter data for the target year
    final filteredData = data
        .where((item) => item.keys.any((key) => key.year == targetYearNumber))
        .toList();

    for (var week = 0; week < (365 ~/ 7); week++) {
      for (var day = 0; day < 7; day++) {
        final x = week * cellSize;
        final y = day * cellSize;

        final currentCellDate =
            currentYearStartDate.add(Duration(days: (week * 7) + day));

        final matchingData = filteredData.firstWhere(
          (item) =>
              item.keys.any((key) => key.isAtSameMomentAs(currentCellDate)),
          orElse: () => {},
        );

        var cellColor = Colors.grey[300]!;
        if (matchingData.isNotEmpty) {
          final value = matchingData.values.first;
          cellColor = _getColorFromSet(value);
        }

        canvas.drawRect(
          Rect.fromPoints(
            Offset(x, y),
            Offset(
              x + cellSize - borderThickness,
              y + cellSize - borderThickness,
            ),
          ),
          Paint()..color = cellColor,
        );
      }
    }
  }

  @override
  bool shouldRepaint(covariant CustomPainter oldDelegate) {
    return true;
  }
}