GraphvizのClojureラッパーであるdorothyを使うと、こんな継承関係の図が簡単に描けます。
dorothyを使うにはあらかじめGraphvizをインストールした後に、GraphvizのbinにPATHを通しておく必要があります。
project.cljの:dependenciesには[dorothy "0.0.5"]を書いとけばOKです。
dorothyの基本
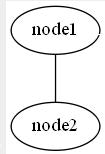
ノード(丸の部分)は[:node1]のような形式か、そのまま:node2と書けます。
エッジ(丸をつなぐ線の部分)は[:a :b :c :d :a]のようにベクタに複数のノード名を入れればよいです。
下記例では:aなどはノードとして定義してないですが、表示してくれるようです。
sample.clj
(ns classzu.sample
  (:require [dorothy.core :refer :all]))

(-> [[:node1] :node2
     [:node1 :node2]]
    graph dot show!)

(-> [[:node1] :node2
     [:a :b :c :d :a]]
    digraph dot show!)
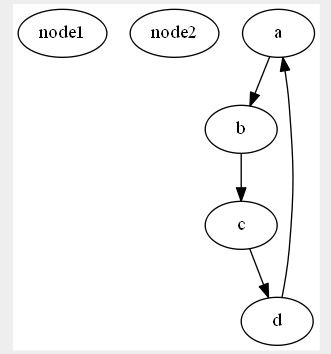
なお、graph(無向グラフ)とdigraph(有向グラフ)が選択できます。
グラフをさらに入れ子にするsubgraphなどもあるようです。
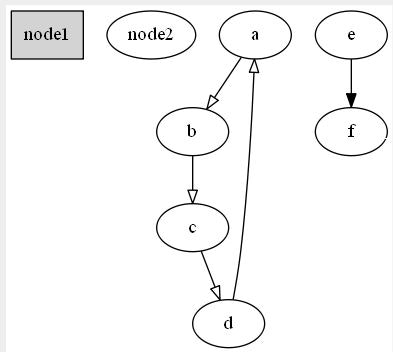
ノードごと、エッジごとのスタイル
ノード定義、エッジ定義の最後にマップをつけることで、Graphvizの属性をつけることができます。
(-> [[:node1 {:style :filled :shape :record}] :node2
     [:a :b :c :d :a {:arrowhead :empty}]
     [:e :f]]
    digraph dot show!)
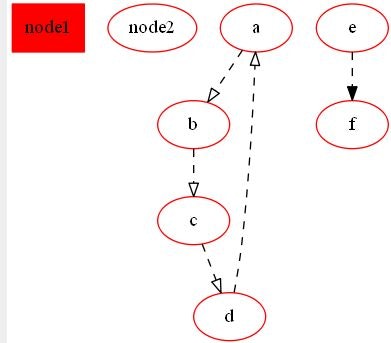
全体のスタイル
node-attrs, edge-attrsを使えば、全ノード・全エッジのスタイルを定義できます。
(-> [(node-attrs {:color :red})
     (edge-attrs {:style :dashed})
     [:node1 {:style :filled :shape :record}] :node2
     [:a :b :c :d :a {:arrowhead :empty}]
     [:e :f]]
    digraph dot show!)
show!だと別ウィンドウでグラフが表示されますが、画像ファイルとして保存したい場合はsave!を使うことができます。
(-> [(node-attrs {:color :red})
     (edge-attrs {:style :dashed})
     [:node1 {:style :filled :shape :record}] :node2
     [:a :b :c :d :a {:arrowhead :empty}]
     [:e :f]]
    digraph dot (save! "out.png" {:format :png}))
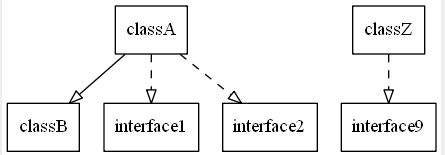
クラス図(継承関係のみ)を描く
まずは、手動でクラス図を描いてみます。
[クラス名、親クラス、実装インタフェース1, 2...]のような形式で複数show-diagramに渡せます。
core.clj
(ns classzu.core
  (:require [dorothy.core :refer :all]
            [clojure.set :as set]
            [clojure.walk :as walk]))

(defn show-diagram [& class-defs]
  (->> (for [[class extends & implements] class-defs]
         (concat [class]
                 (when extends [[class extends]])
                 (map (fn [i] [class i {:style :dashed}]) implements)))
       (apply concat)
       (list* (node-attrs {:shape :record})
              (edge-attrs {:arrowhead :empty}))
       digraph dot show!))

(show-diagram [:classA :classB :interface1 :interface2] [:classZ nil :interface9])
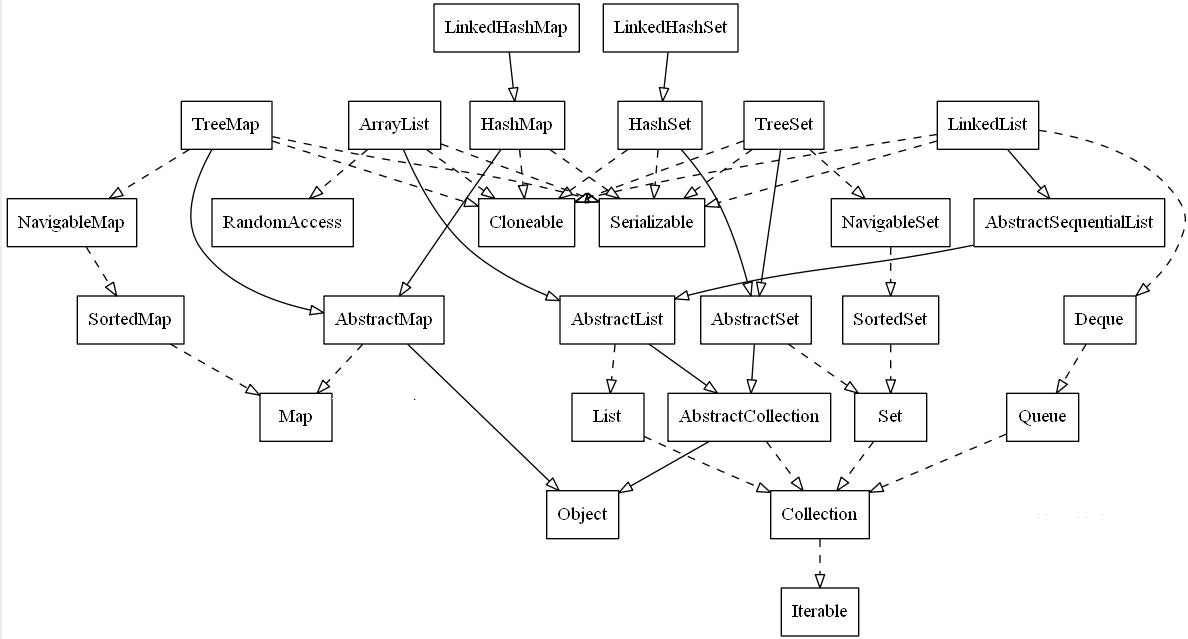
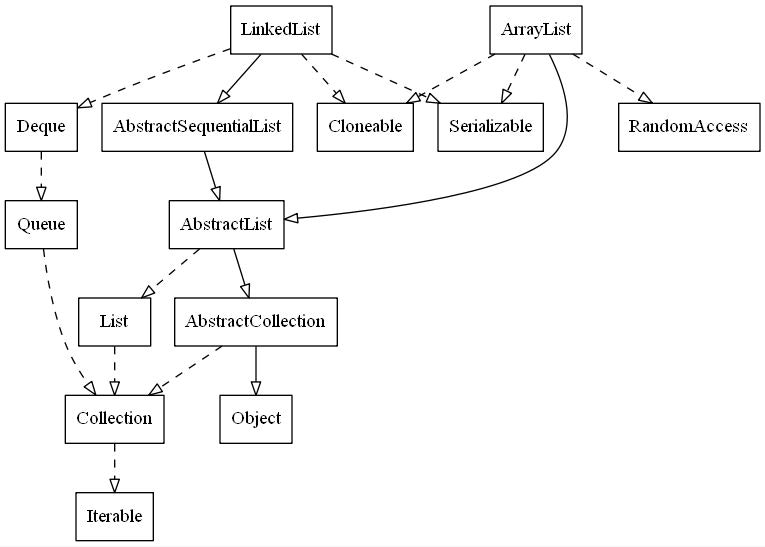
Classオブジェクトからグラフを描く
Classオブジェクトからshow-diagramに渡す定義を自動生成してグラフを描いてみます。
(defn get-classdef [^Class c]
  (->> (list* c (.getSuperclass c) (apply set/difference (supers c) #{(.getSuperclass c)} (map supers (supers c))))
       (walk/postwalk #(if (or (nil? %) (sequential? %)) % (keyword (.getSimpleName %))))))

(defn get-all-classdefs [& classes]
  (distinct (concat (map get-classdef classes)
                    (mapcat #(apply get-all-classdefs (supers %)) classes))))

(import '[java.util ArrayList LinkedList])
(apply show-diagram (get-all-classdefs ArrayList LinkedList))
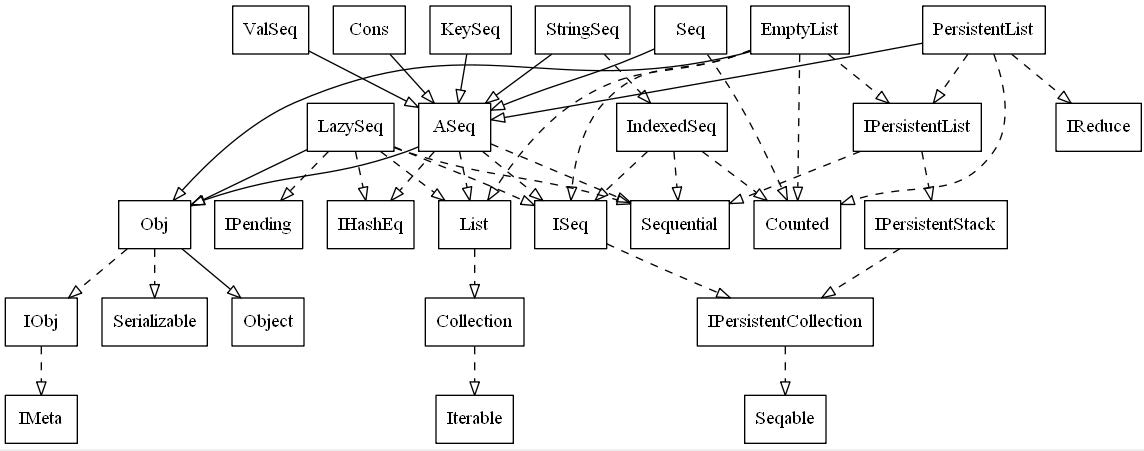
Clojureのいろんなシーケンスをグラフにしてみるとこんな感じになります。
(apply show-diagram (apply get-all-classdefs (map class [() '(1) (range 1) (seq "a") (cons 1 [])
                                                         (seq {1 2}) (keys {1 2}) (vals {1 2})])))
簡単にグラフ描けてすばらです~