概要
- コロナの陽性者数がどう変化するのか気になったので、時系列分析を使って予測をしていきます。
- 実行結果は正解データ無しとありで見ていきたいと思います。
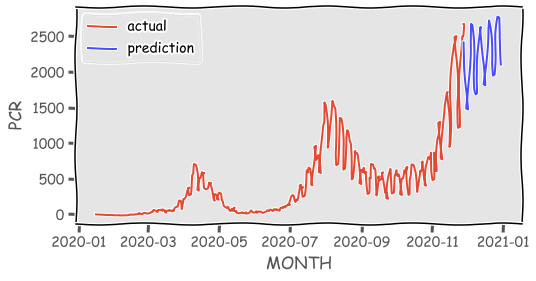
実行結果(正解データ無し)
- actualは実際の値(赤線)、predictionは予測の値(青線)
- 12月31日まで予測
- 徐々に陽性者数が伸びている。
- 正解データが無いため、この予測があっているか不明。
コード
import pandas as pd
import matplotlib.pyplot as plt
import warnings
warnings.filterwarnings('ignore') # 計算警告を非表示

plt.style.use('ggplot') # グラフのデザイン変更(お好みで利用)
plt.xkcd() # グラフのデザイン変更(お好みで利用、日本語は未対応)
import statsmodels.api as sm # version 0.8.0以上

# CSVファイル読み込み(事前にダウンロードしたCSVファイルを利用)
df = pd.read_csv("data/pcr_positive_daily.csv")

corona = pd.Series(df["PCR 検査陽性者数(単日)"].values,
                        index=pd.to_datetime(df["日付"]))

corona_train2 = corona["2020-01-16":"2020-11-28"]


# SRIMAモデル(テストデータ1年を除いてモデル作成)
sarimax_train = sm.tsa.SARIMAX(corona_train2,
                        order=(3, 1, 3),
                        seasonal_order=(0, 1, 1, 30),
                        enforce_stationarity = False,
                        enforce_invertibility = False
                        ).fit()

sarimax_train2_pred = sarimax_train.predict("2020-11-28", "2020-12-31") # テストデータ1年分予測

plt.figure(figsize=(8, 4))

plt.plot(corona, label="actual")
plt.plot(sarimax_train2_pred, c="b", label="prediction", alpha=0.7)
plt.ylabel('PCR')
plt.xlabel('MONTH')
plt.legend(loc='best')
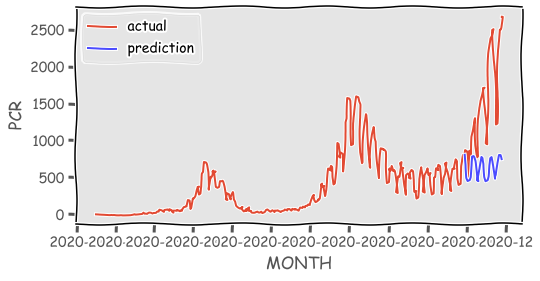
実行結果(正解データあり)
- actualは実際の値(赤線)、predictionは予測の値(青線)
- 10月30日から11月28日のテストデータでは陽性者数が下がっている。
- 予測の精度が低いことがわかった。
コード
import pandas as pd
import matplotlib.pyplot as plt
import warnings
warnings.filterwarnings('ignore') # 計算警告を非表示

plt.style.use('ggplot') # グラフのデザイン変更(お好みで利用)
plt.xkcd() # グラフのデザイン変更(お好みで利用、日本語は未対応)
import statsmodels.api as sm # version 0.8.0以上

# CSVファイル読み込み(事前にダウンロードしたCSVファイルを利用)
df = pd.read_csv("data/pcr_positive_daily.csv")

corona = pd.Series(df["PCR 検査陽性者数(単日)"].values,
                       index=pd.to_datetime(df["日付"]))

corona_train2 = corona["2020-01-16":"2020-10-30"]
corona_test2 = corona['2020-11-01':'2020-11-28']

# SRIMAモデル(テストデータ1年を除いてモデル作成)
sarimax_train = sm.tsa.SARIMAX(corona_train2,
                        order=(3, 1, 3),
                        seasonal_order=(0, 1, 1, 30),
                        enforce_stationarity = False,
                        enforce_invertibility = False
                        ).fit()
sarimax_train2_pred = sarimax_train.predict("2020-10-30", "2020-11-28") # テストデータ1年分予測

plt.figure(figsize=(8, 4))

plt.plot(corona, label="actual")
plt.plot(sarimax_train2_pred, c="b", label="prediction", alpha=0.7)
plt.ylabel('PCR')
plt.xlabel('MONTH')
plt.legend(loc='best')
まとめ
- データ数が少ないため、精度の低い予測グラフとなった。
- 陽性者数以外のデータを加えることで、精度を上げることが可能かも…?

