クラスタ分析って?K平均法って?
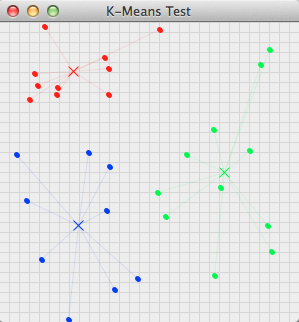
こんなの。
クラスタ分析:データを似たもの同士グループ分けする分析。
K平均法:クラスタ分析の手法のひとつ。
応用分野は色々あるけど、まぁ一番わかりやすい例が
座標上にバラバラに散らばった点をご近所さん同士まとめるプログラム。
今回作るのがこれ。
どうやるの?
Wikipediaによると、こうやるらしい。
K-平均法は、一般には以下のような流れで実装される。
データの数を n 、クラスタの数を K としておく。1.各データ x_i(i=1... n) に対してランダムにクラスタを割り振る。
2.割り振ったデータをもとに各クラスタの中心 V_j(j=1... K) を計算する。計算は通常割り当てられたデータの各要素の算術平均が使用される。
3.各 x_i と各 V_j との距離を求め、x_i を最も近い中心のクラスタに割り当て直す。
4.上記の処理で全ての x_i のクラスタの割り当てが変化しなかった場合、あるいは変化量が事前に設定した一定の閾値を下回った場合に、収束したと判断して処理を終了する。そうでない場合は新しく割り振られたクラスタから V_j を再計算して上記の処理を繰り返す。
やることは簡単なんだろうけど、なんか難しい。
ようするに、
- ランダムに点をばら撒くよ。適当に根拠なくグループ分けするよ。
- 各グループの中心を求めるよ。
- さっきのグループ分けは適当だったから、一番近いグループの中心に基づいて再度グループ分けし直すよ。
- 1~3を変化がなくなるまで繰り返すよ。
こういうことなんだと思う。
作ってみた。
冒頭のこれ。これを今回作ってみた。
ソース
合計99行。100行以内に収まった。嬉しい。
説明は後ろのほうでします。
# -*- coding: utf-8 -*-
import wx
import random
import math


class MyMainWindow(wx.Frame):
    def __init__(self, parent=None, id=-1, title=None):
        #フレームにパネルを設定
        wx.Frame.__init__(self, parent, id, title)
        self.panel = wx.Panel(self, size=(300, 300))
        self.panel.SetBackgroundColour('000000')
        self.Fit()
        #イベント
        self.panel.Bind(wx.EVT_PAINT, self.on_paint)
        self.panel.Bind(wx.EVT_LEFT_DOWN, self.on_left_click)
        self.panel.Bind(wx.EVT_RIGHT_DOWN, self.on_right_click)
        #変数初期化
        self.dots = []
        self.dc = None
        #クラスタは赤緑青の三種類
        self.cluster_types = ('#FF0000', '#00FF00', '#0000FF')
        self.clusters = [(0, 0), (0, 0), (0, 0)]
        #dotの初期セット
        self.shuffle_dots()

    def on_paint(self, event):
        u"""描画イベント"""
        self.dc = wx.PaintDC(self.panel)
        #マス目を書く
        self.dc.SetPen(wx.Pen('#CCCCCC', 1))
        for x in range(0, 300, 10):
            self.dc.DrawLine(x, 0, x, 300)
            for y in range(0, 300, 10):
                self.dc.DrawLine(0, y, 300, y)
            #dotを描画する
        for dot in self.dots:
            self.dc.SetPen(wx.Pen(self.cluster_types[dot['cluster']], 5))
            self.dc.DrawPoint(dot['x'], dot['y'])
            #クラスタの重心を描画する。
        self.draw_cluster()

    def on_left_click(self, evt):
        u"""左クリックでクラスタを再計算"""
        self.change_cluster()
        self.Refresh()

    def on_right_click(self, evt):
        u"""右クリックでdotをリセット"""
        self.shuffle_dots()
        self.Refresh()

    def shuffle_dots(self):
        u"""dotをランダムに配置する。"""
        self.dots = []
        for i in range(30):
            self.dots.append({'x': random.randint(0, 300),
                              'y': random.randint(0, 300),
                              'cluster': random.randint(0, len(self.cluster_types) - 1)})

    def draw_cluster(self):
        u"""クラスタを描画する。"""
        self.clusters = []
        for c in range(len(self.cluster_types)):
            #クラスタの重心=クラスタに所属するdotの座標の平均
            self.dc.SetPen(wx.Pen(self.cluster_types[c], 1))
            count = sum(1 for dot in self.dots if dot['cluster'] == c)
            x = sum(dot['x'] for dot in self.dots if dot['cluster'] == c) // count if count != 0 else 150
            y = sum(dot['y'] for dot in self.dots if dot['cluster'] == c) // count if count != 0 else 150
            self.clusters.append({'x': x, 'y': y})
            #クラスタを×印で描画
            self.dc.DrawLine(x - 5, y - 5, x + 5, y + 5)
            self.dc.DrawLine(x + 5, y - 5, x - 5, y + 5)
            #クラスタから各dotまでを線で引く。
            self.dc.SetPen(wx.Pen(self.cluster_types[c], 0.8))
            for dot in self.dots:
                if dot['cluster'] == c:
                    self.dc.DrawLine(x, y, dot['x'], dot['y'])

    def change_cluster(self):
        u"""各dotの所属を最寄りのクラスタに変更する。"""
        for d in range(len(self.dots)):
            near_dist = 99999
            #二点間の距離=√( (X1-X2)^2+(Y1-Y2)^2 )
            for c in range(len(self.cluster_types)):
                dist = math.sqrt(
                    (self.dots[d]['x'] - self.clusters[c]['x']) ** 2 + (self.dots[d]['y'] - self.clusters[c]['y']) ** 2)
                #一番最寄りのクラスタに鞍替え
                if near_dist >= dist:
                    self.dots[d]['cluster'] = c
                    near_dist = dist


if __name__ == '__main__':
    app = wx.PySimpleApp()
    w = MyMainWindow(title='K-Means Test')
    w.Center()
    w.Show()
    app.MainLoop()
解説
wxPython
今回はwxPythonというGUIライブラリを使用。
MacでもWindowsでもLinuxでも動いて、各プラットフォームに馴染んだ感じで表示してくれるスグレモノ。
class MyMainWindow(wx.Frame):
wx.Frameを継承したクラスを作って、
if __name__ == '__main__':
    app = wx.PySimpleApp()
    w = MyMainWindow(title='K-Means Test')
    w.Center()
    w.Show()
    app.MainLoop()
呼び出す。
こんな流れ。
はい。ここからは実際のロジックの説明。
ランダムに点をばら撒いて適当にグループ分け
shuffle_dots()
この関数で点をばらまいて、dotsという配列に入れてます。
そのとき適当にグループを割り振ってます。
グループの中心を求める
draw_cluster()
グループに所属する各点の平均を求めて、グループの中心にしています。
ついでに中心から各点まで線を引いて分かりやすく。
最寄りのグループに鞍替え
change_cluster()
二点間の距離=√( (X1-X2)^2+(Y1-Y2)^2 )
この式で各点とグループの中心の距離を求めて、一番近いグループに鞍替え。
あったなぁこんな公式。中学以来初めて役に立った。
画面に描画
on_paint()
描画のタイミングでこの関数が呼ばれる。
なぜなら冒頭のself.panel.Bind(wx.EVT_PAINT, self.on_paint)で紐付けしたから。
説明と処理の順番が前後したけど、この関数の中でさっき説明した処理が呼び出される。
あと繰り返す
クリックするたびに今までの流れを再計算。
何回か押せば完成形まで分類される。
左クリックで配置やりなおし。
まとめ
なかなか敷居の高そうな分析方法だけど、
実際やってみると割りとシンプル。
ただしこのK平均法は偏った結果になりやすいので、
改良された分析方法があるらしい。
座標に点をポチポチ打ちこんでグループ分けしてもひたすら虚しいだけなので、
X軸を猫好き度、Y軸を犬好き度に割り当てた好きなどうぶつ類似度分析なんかも面白いかもしれない。
あと座標系を2つ増やして四次元クラスタ分析とかいいなぁ。なんか未来感がある。
