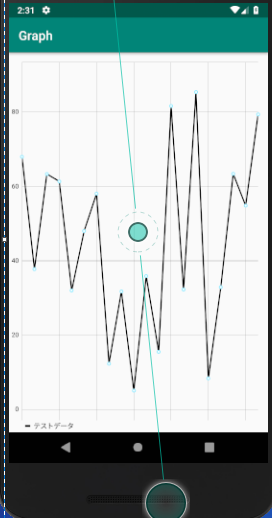
グラフをアプリの中に表示させるとき、調べてみるとMPAndroidChartを使う方法があるみたいで、簡単なサンプルを作って試してみました。
データを取得できれば、なかなかお手軽でいいですね!
今後も使いそうなので、手順を残そうかと思います。
①ライブラリの導入
まずはMPAndroidChartライブラリを導入します。
build.gradle(Project)
allprojects {
    repositories {
        // 追加
        maven { url 'https://jitpack.io' }
    }
}
build.gradle(app)
dependencies {
    // 追加
    implementation 'com.github.PhilJay:MPAndroidChart:v3.1.0'
}
②レイアウトの作成
レイアウトの作成を行います。
今回はシンプルに画面いっぱいにグラフを表示させるだけです。
activity_main
<?xml version="1.0" encoding="utf-8"?>
<android.support.constraint.ConstraintLayout
xmlns:android="http://schemas.android.com/apk/res/android"
xmlns:tools="http://schemas.android.com/tools"
xmlns:app="http://schemas.android.com/apk/res-auto"
android:layout_width="match_parent"
android:layout_height="match_parent"
tools:context=".MainActivity">

    <com.github.mikephil.charting.charts.LineChart
        android:id="@+id/lineChart"
        android:layout_width="match_parent"
        android:layout_height="match_parent"
    />

</android.support.constraint.ConstraintLayout>
③Actitvityの作成
Activityではグラフの作成を行います。
グラフの作成するにあたって、データの設定とグラフの設定(X軸やY軸など)がメインで必要になります。
グラフ表示のオプションはたくさんあるので、リファレンスを見て、必要なら追加するのがいいと思います。
MainActivity.kt
class MainActivity : AppCompatActivity() {

    // スタイルとフォントファミリーの設定
    private var mTypeface = Typeface.create(Typeface.SANS_SERIF, Typeface.NORMAL)
    // データの個数
    private val chartDataCount = 20

    override fun onCreate(savedInstanceState: Bundle?) {
        super.onCreate(savedInstanceState)
        setContentView(R.layout.activity_main)

        // グラフの設定
        setupLineChart()
        // データの設定
        lineChart.data = lineData(chartDataCount, 100f)
    }

    // LineChart用のデータ作成
    private fun lineData(count: Int, range: Float):LineData {

        val values = mutableListOf<Entry>()

        for (i in 0 until count) {
            // 値はランダムで表示させる
            val value = (Math.random() * (range)).toFloat()
            values.add(Entry(i.toFloat(), value))
        }

        // グラフのレイアウトの設定
        val yVals = LineDataSet(values, "テストデータ").apply {
            axisDependency =  YAxis.AxisDependency.LEFT
            color = Color.BLACK
            // タップ時のハイライトカラー
            highLightColor = Color.YELLOW
            setDrawCircles(true)
            setDrawCircleHole(true)
            // 点の値非表示
            setDrawValues(false)
            // 線の太さ
            lineWidth = 2f
        }
        val data = LineData(yVals)
        return data
    }

    private fun setupLineChart(){
        lineChart.apply {
            description.isEnabled = false
            setTouchEnabled(true)
            isDragEnabled = true
            // 拡大縮小可能
            isScaleXEnabled = true
            setPinchZoom(false)
            setDrawGridBackground(false)

            //データラベルの表示
            legend.apply {
                form = Legend.LegendForm.LINE
                typeface = mTypeface
                textSize = 11f
                textColor = Color.BLACK
                verticalAlignment = Legend.LegendVerticalAlignment.BOTTOM
                horizontalAlignment = Legend.LegendHorizontalAlignment.LEFT
                orientation = Legend.LegendOrientation.HORIZONTAL
                setDrawInside(false)
            }

            //y軸右側の設定
            axisRight.isEnabled = false

            //X軸表示
            xAxis.apply {
                typeface = mTypeface
                setDrawLabels(false)
                // 格子線を表示する
                setDrawGridLines(true)
            }

            //y軸左側の表示
            axisLeft.apply {
                typeface = mTypeface
                textColor = Color.BLACK
                // 格子線を表示する
                setDrawGridLines(true)
            }
        }
    }
}
完成したのはこんな感じです。
線グラフ以外にも棒グラフや円グラフなど、多様に使えそうなので、いろいろ試してみたいと思います。
