この記事を読むとできるようになること
matplotlibで,一部を拡大した図を同じプロットに挿入できる
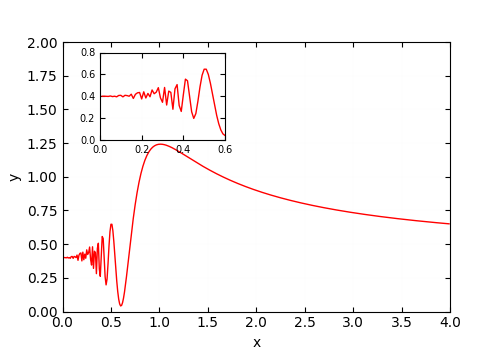
こういうやつが描きたかった.
- 環境
- macOS mojave 10.14.6
- Python 3.7.6
なんのことはない簡単な手順で,
subplot の枠を用意してあげればいいだけです.
zoom.py
# !/usr/bin/env python
# -*- coding: utf-8 -*-

import matplotlib.pyplot as plt

fig = plt.figure()
ax = fig.add_subplot(111)

fig = plt.figure()

ax1 = fig.add_subplot(111)
ax1.tick_params(which='both', direction='in', top=bool, right=bool, labelbottom=True)
ax1.set_xlim(0.0, 4.0)
ax1.set_xlabel("x")
ax1.set_ylim(0, 2)
ax1.set_ylabel("y")

# 関数の作成
x = np.arange(0.01, 4.0, 0.01)
y = x*x*np.sin(1.0/(x*x*x)) +0.4
ax1.plot(x, y, "-", color='red', lw=1)

# zoomするsubplotの位置
# axes([左からどのくらい離すか, 下からどのくらい離すか, 幅, 高さ])
sub_axes = plt.axes([.2, .6, .25, .25])
sub_axes.tick_params(which='both', direction='in', top=bool, right=bool, labelbottom=True)
sub_axes.tick_params(labelsize=7)
sub_axes.grid(which='major',color='gray',alpha=0.1,linestyle=':',linewidth=0.3)
sub_axes.set_xlim(0.0, 0.6)
sub_axes.set_xticks( [0, 0.2, 0.4, 0.6] )
sub_axes.set_ylim(0.0, 0.8)

# subplotを描く
sub_axes.plot(x, y)

plt.savefig("zoom.eps")