DoWhyによる因果推論
DoWhyの方向性とやり方のメモ(備忘録)
目次
◆はじめに
◆必要性
◆導入環境
◆導入法
◆動かしてみた
--準備
--データ生成
--Model(仮定)
--Identification(変数の識別)
--Estimation(数式から推定)
--Check(Sensitivity Analysis)
◆参照
はじめに
DoWhyはMicrosoftがリリースした因果推論ライブラリ(Python)。このライブラリはJudea Pearlの"do-calculus"の考え方が根底にある。なので、分析者自身がデータの要素について、どのように交絡しているかをあらかた検討してDAGを描く必要がある。私的には推定に重きを置く既存の他のパッケージまたはライブラリとは異なり、DoWhyは設定した仮定に重きを置いている印象がある。ある因果効果について検証したい場合、推定に必要な数式を導入して推定したらお終い、ではなくその後にその仮定がどれくらい妥当なものなのかを検討する工程がある。やみくもにただ推定するだけではなくチェック段階を強調する本ライブラリは統計的因果推論を学習する上で、考え方の軸が太くなるものだと思われる。
必要性
予測モデルは、観測データのInputとOutcomeを結び付けるパターンを明らかにする。しかしながら、介入を実施してその効果を見たい場合には、データが存在しない現在の値から、Inputを変更した場合の影響を推定する必要がある。これは以下のような反事実の推定を行うことである。
・Will it work?
システムの変更は結果を改善しうるものなのか?
・Why did it work?
結果に変化をもたらしたものは何か?
・What should we do?
システムにどのような変更を加えたら、結果が改善されるか?
・What are the overall effects?
システムはどのように他の要因と作用し、その要因に影響を及ぼすか?
これらの疑問に答えるには因果推論が必要で、多くの方法があるが仮定と結果のロバスト性(assumptions and robustness of results)を比較することは困難である。
そこでDoWhyでは、与えられた問いを因果グラフとしてモデル化する原則的な方法を用いて、すべての仮定が明確になるようにする。次に、モデルと潜在的な結果のフレームワークを組み合わせて、一般的な因果推論に帰着させる。そして可能であれば、仮定の妥当性を自動的にテストしてミスに対する推定値のロバスト性を評価する。
導入環境
OS: Mojave (version; 10.14.6)
Python: 3.7.6
JupyterLab: 1.2.6
Graphviz: 2.40.1
導入法
以下のようにしてインストールした。
$ pip install dowhy
それとPyGraphvizを入れてなかったので、それも入れた。
$ sudo pip install --install-option="--include-path=/usr/local/include/" --install-option="--library-path=/usr/local/lib/" pygraphviz
動かしてみた
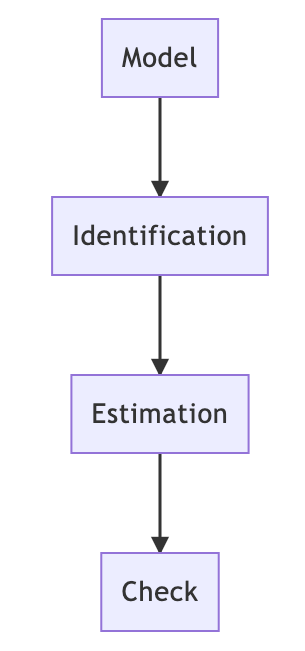
DoWhyの主要な流れは以下。
基本的には図に沿って実行していく。
準備
import numpy as np
import pandas as pd
import dowhy
from dowhy import CausalModel
import dowhy.datasets
import pygraphviz
データ生成
data = dowhy.datasets.linear_dataset(beta=10, # 真の因果効果
                                    num_common_causes=5, # 観測された共通原因
                                    num_instruments=2, # 原因への変数
                                    num_samples=10000, # サンプル数
                                    treatment_is_binary=True)
df = data["df"]
print(df.head())
print(data["dot_graph"])
print("\n")
print(data["gml_graph"])
# 結果が以下
    Z0        Z1        W0        W1        W2        W3        W4    v0  \
0  0.0  0.697077  0.145565 -1.297894  2.226496  1.645846 -0.385215  True
1  0.0  0.427846  0.356681  1.331070  0.740072  0.265514 -1.838137  True
2  1.0  0.525590  0.383658  0.535433  0.795982  1.743974 -1.554143  True
3  0.0  0.135632 -0.002793 -0.607062  1.111112  0.558599 -1.201494  True
4  1.0  0.966809 -0.613649  2.351279  0.746445 -1.000265 -0.700003  True

           y
0  11.272817
1  13.219180
2  12.116330
3   7.008058
4  18.573009
digraph { U[label="Unobserved Confounders"]; U->y;v0->y; U->v0;W0-> v0; W1-> v0; W2-> v0; W3-> v0; W4-> v0;Z0-> v0; Z1-> v0;W0-> y; W1-> y; W2-> y; W3-> y; W4-> y;}
処置(原因)は"v0"で、結果が"y"となっている。
未観測共通原因は"U"として、"W"(0-4)は観測されている共通原因、そして"Z"(0-1)は"v0"の観測された変数。
上記のことが既知として、効果を推定する(真の因果効果10にどれだけ近づくか見ていく)。
Model(仮定)
model = CausalModel(
        data=df,
        treatment=data["treatment_name"],
        outcome=data["outcome_name"],
        graph=data["gml_graph"])
# 結果
INFO:dowhy.causal_model:Model to find the causal effect of treatment ['v0'] on outcome ['y']
DAGを描く
model.view_model()
from IPython.display import Image, display
display(Image(filename="causal_model.png"))
Identification(変数の識別)
先ほど描いたDAGから、推定に用いる変数を見積もる。
identified_estimand = model.identify_effect()
print(identified_estimand)
# 結果
INFO:dowhy.causal_identifier:Common causes of treatment and outcome:['W4', 'W2', 'W1', 'W3', 'W0', 'U']

WARNING:dowhy.causal_identifier:If this is observed data (not from a randomized experiment), there might always be missing confounders. Causal effect cannot be identified perfectly.

WARN: Do you want to continue by ignoring any unobserved confounders? (use proceed_when_unidentifiable=True to disable this prompt) [y/n]  y

INFO:dowhy.causal_identifier:Instrumental variables for treatment and outcome:[]

Estimand type: nonparametric-ate
### Estimand : 1
Estimand name: backdoor
Estimand expression:
  d
─────(Expectation(y|W4,W2,W1,W3,W0))
d[v₀]
Estimand assumption 1, Unconfoundedness: If U→{v0} and U→y then P(y|v0,W4,W2,W1,W3,W0,U) = P(y|v0,W4,W2,W1,W3,W0)

### Estimand : 2
Estimand name: iv
No such variable found!
先ほどのDAGが正しく、Conditional Exchangeabilityが成立する場合(すなわち仮定が正しい場合)の見積もり結果となっている。
Backdoor基準から、"v0"を変化させた時の"W"で条件付けられた"y"の変化量が求めたいATEとなっている。
Estimation(数式から推定)
ここでは数式を用いて先ほどの結果を実際に当てはめて計算する。
DoWhyでは以下が利用可能。
- 回帰
- 層別
- マッチング
- IPW
- IV
- RDD
また、CATE(conditional ATE)の推定に利用されるPythonライブラリであるEconML(microsoft)と併用することで、CATEも利用可能。
(まだ読みきれていない。EconML利用できるということはMeta-LeanerやORFとかを観察データから推定に利用できることなのか?)
今回は層別を実行した。
causal_estimate = model.estimate_effect(identified_estimand,
                                       method_name="backdoor.propensity_score_stratification") # backdoor.xxxの末尾で変更する
print(causal_estimate)
print("Causal Estimate is" + str(causal_estimate.value))
# 結果
INFO:dowhy.causal_estimator:INFO: Using Propensity Score Stratification Estimator

INFO:dowhy.causal_estimator:b: y~v0+W4+W2+W1+W3+W0

*** Causal Estimate ***

## Target estimand
Estimand type: nonparametric-ate
### Estimand : 1
Estimand name: backdoor
Estimand expression:
  d
─────(Expectation(y|W4,W2,W1,W3,W0))
d[v₀]
Estimand assumption 1, Unconfoundedness: If U→{v0} and U→y then P(y|v0,W4,W2,W1,W3,W0,U) = P(y|v0,W4,W2,W1,W3,W0)

### Estimand : 2
Estimand name: iv
Estimand expression:
Expectation(Derivative(y, [Z1, Z0])*Derivative([v0], [Z1, Z0])**(-1))
Estimand assumption 1, As-if-random: If U→→y then ¬(U →→{Z1,Z0})
Estimand assumption 2, Exclusion: If we remove {Z1,Z0}→{v0}, then ¬({Z1,Z0}→y)

## Realized estimand
b: y~v0+W4+W2+W1+W3+W0
## Estimate
Value: 10.074645926227818

Causal Estimate is10.074645926227818
最後のEstimateが推定した値である(ちなみにデータ生成の段階では因果効果を10に設定している)。
Check(Sensitivity Analysis)
手持ちのデータには含まれないような変数が、バイアスとなる可能性は常に存在する。そして、今回なら仮定を立ててBackdoor基準を採用して、それを基に因果効果を推定した。しかしながら、この仮定が正しいことは保証されていない。そこで、分析者が重要だと認識する共変量以外の変数をモデルから変更することで、効果の推定値が大きく変動しないかを確認する作業である。
- ランダムな共通原因変数を追加する
res_random=model.refute_estimate(identified_estimand, estimate, method_name="random_common_cause")
print(res_random)
# 結果
INFO:dowhy.causal_estimator:INFO: Using Propensity Score Stratification Estimator

INFO:dowhy.causal_estimator:b: y~v0+W4+W2+W1+W3+W0+w_random

Refute: Add a Random Common Cause
Estimated effect:(10.074645926227818,)
New effect:(9.950638858187622,)
- 未観測共通原因を追加
res_unobserved=model.refute_estimate(identified_estimand, estimate, method_name="add_unobserved_common_cause",
                                     confounders_effect_on_treatment="binary_flip", confounders_effect_on_outcome="linear",
                                    effect_strength_on_treatment=0.01, effect_strength_on_outcome=0.02)
print(res_unobserved)
# 結果
INFO:dowhy.causal_estimator:INFO: Using Propensity Score Stratification Estimator

INFO:dowhy.causal_estimator:b: y~v0+W4+W2+W1+W3+W0

Refute: Add an Unobserved Common Cause
Estimated effect:(10.074645926227818,)
New effect:(9.189776632922118,)
- 原因(v0)をランダムな変数に置換
res_placebo=model.refute_estimate(identified_estimand, estimate,
                                 method_name="placebo_treatment_refuter",
                                 placebo_type="permute")
print(res_placebo)
# 結果
INFO:dowhy.causal_estimator:INFO: Using Propensity Score Stratification Estimator

INFO:dowhy.causal_estimator:b: y~placebo+W4+W2+W1+W3+W0

Refute: Use a Placebo Treatment
Estimated effect:(10.074645926227818,)
New effect:(0.07317739755853733,)
- 基データのサブセットで推定
res_subset=model.refute_estimate(identified_estimand, estimate,
                                 method_name="data_subset_refuter",
                                 subset_fraction=0.9) # 基データから抽出するデータの割合
print(res_subset)
# 結果
INFO:dowhy.causal_estimator:INFO: Using Propensity Score Stratification Estimator

INFO:dowhy.causal_estimator:b: y~v0+W4+W2+W1+W3+W0

Refute: Use a subset of data
Estimated effect:(10.074645926227818,)
New effect:(10.125793210348078,)
また、再現性のためにrandom.seedを設定することも可能。
res_subset=model.refute_estimate(identified_estimand, estimate,
                                 method_name="data_subset_refuter",
                                 subset_fraction=0.9, random_seed=1) # サブセットの割合とシード値の設定
print(res_subset)
# 結果
INFO:dowhy.causal_estimator:INFO: Using Propensity Score Stratification Estimator

INFO:dowhy.causal_estimator:b: y~v0+W4+W2+W1+W3+W0

Refute: Use a subset of data
Estimated effect:(10.074645926227818,)
New effect:(10.068276205100556,)
参照
- 「統計的因果推論のためのPythonライブラリDoWhyについて解説:なにができて、なにに注意すべきか」(KRSK さん)
https://www.krsk-phs.com/entry/2018/08/22/060844 - microsoft/dowhy(GitHub)
https://github.com/microsoft/dowhy - DoWhyのDocs
https://microsoft.github.io/dowhy/index.html#

