R言語を使ってk-means(K平均法)を使った非階層型クラスタリングを実行する手順を自分用のメモとしてまとめました。
手順 1: サンプルデータ Animals を読み込みます
R> library("MASS")
R> data("Animals")
R> Animals
手順 2: 関数 str() を使って、データフレーム Animals の構造を確認します
R> str(Animals)
'data.frame':   28 obs. of  2 variables:
 $ body : num  1.35 465 36.33 27.66 1.04 ...
 $ brain: num  8.1 423 119.5 115 5.5 ...
→ 1行目に body(体重)、2行目に brain(脳の重さ)が格納された data.frame 型のオブジェクトであることを確かめます。
手順 3: 関数 kemeans() を使って、K平均法を使った非階層型クラスタリングを実行します
R> animals.cluster <- kmeans(x=Animals, centers=5)
R> animals.cluster
K-means clustering with 5 clusters of sizes 2, 2, 7, 16, 1

Cluster means:
         body      brain
1  4600.50000 5157.50000
2 10550.00000   60.00000
3   289.03714  620.42857
4    29.50156   72.13125
5 87000.00000  154.50000

Clustering vector:
 Mountain beaver              Cow        Grey wolf             Goat
               4                3                4                4
      Guinea pig      Dipliodocus   Asian elephant           Donkey
               4                2                1                3
           Horse     Potar monkey              Cat          Giraffe
               3                4                4                3
         Gorilla            Human African elephant      Triceratops
               3                3                1                2
   Rhesus monkey         Kangaroo   Golden hamster            Mouse
               4                4                4                4
          Rabbit            Sheep           Jaguar       Chimpanzee
               4                4                4                3
             Rat    Brachiosaurus             Mole              Pig
               4                5                4                4

Within cluster sum of squares by cluster:
[1] 9048665.0 2645200.0  919359.5  120741.1       0.0
 (between_SS / total_SS =  99.8 %)

Available components:

[1] "cluster"      "centers"      "totss"        "withinss"
[5] "tot.withinss" "betweenss"    "size"         "iter"
[9] "ifault"
手順 4: 関数 tapply() を使って、データの要素名をクラスター別に表示します
R> tapply(names(animals.cluster$cluster), animals.cluster$cluster, "unique")
$`1`
[1] "Asian elephant"   "African elephant"

$`2`
[1] "Dipliodocus" "Triceratops"

$`3`
[1] "Cow"        "Donkey"     "Horse"      "Giraffe"    "Gorilla"
[6] "Human"      "Chimpanzee"

$`4`
 [1] "Mountain beaver" "Grey wolf"       "Goat"            "Guinea pig"
 [5] "Potar monkey"    "Cat"             "Rhesus monkey"   "Kangaroo"
 [9] "Golden hamster"  "Mouse"           "Rabbit"          "Sheep"
[13] "Jaguar"          "Rat"             "Mole"            "Pig"

$`5`
[1] "Brachiosaurus"
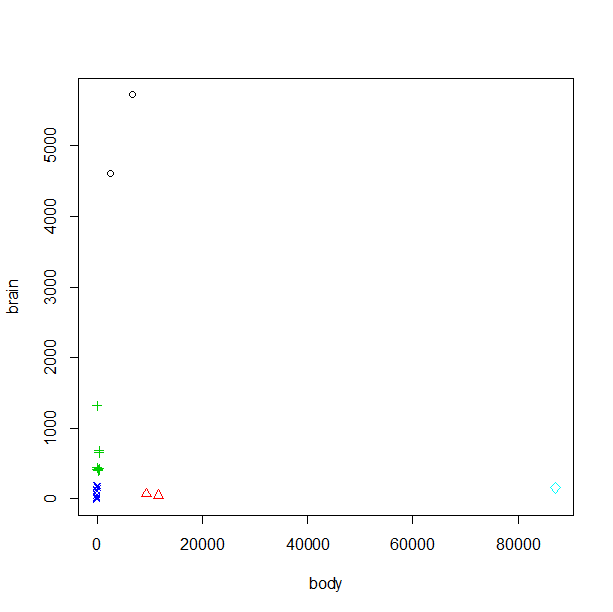
手順 5: 関数 plot() を使って、散布図を確認します
R> plot(x=Animals, col=animals.cluster$cluster, pch=animals.cluster$cluster)
以上
