scipy.stats.describe:記述統計量の算出
↓公式ドキュメント
実装
インポート
import pandas as pd
from sklearn.datasets import fetch_california_housing
from scipy import stats
データセットの読み込み
housing = fetch_california_housing()

data_arr = housing.data
features = housing.feature_names
記述統計量の算出
引数とデフォルト値は以下の通り。
scipy.stats.describe(a, axis=0, ddof=1, bias=True, nan_policy='propagate')
-
a:入力データ(配列)を渡す。 -
axis:=0(デフォルト値)で列方向、=1で行方向、=Noneで配列全体の統計量を算出する。 -
ddof:=1のとき不偏分散を出力する。=0だと不偏でない分散になる。
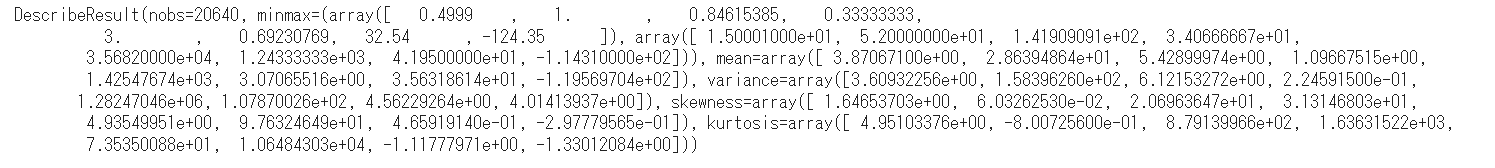
使用例
stats.describe(a=data_arr)
出力結果
サンプルサイズ、最小値、最大値、平均値、分散、歪度、尖度が出力される。
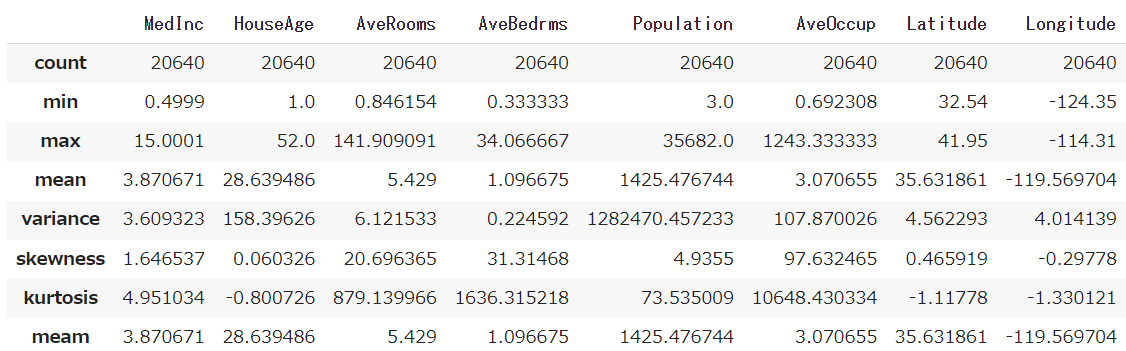
pandas.DataFrameに変換
descriptive = stats.describe(data_arr)

idx = ['count',
       'min',
       'max',
       'mean',
       'variance',
       'skewness',
       'kurtosis'
       ]
df_descriptive = pd.DataFrame(index=idx, columns=features)

df_descriptive.loc[idx[0]] = descriptive[0]
df_descriptive.loc[idx[1]] = descriptive[1][0]
df_descriptive.loc[idx[2]] = descriptive[1][1]
df_descriptive.loc[idx[3]] = descriptive[2]
df_descriptive.loc[idx[4]] = descriptive[3]
df_descriptive.loc[idx[5]] = descriptive[4]
df_descriptive.loc[idx[6]] = descriptive[5]

df_descriptive