Quantopian でボリンジャーバンドを利用した米国株売買アルゴリズムを開発してみる
はじめに
米国株式投資のシステムトレードプラットフォームである Quantopian 上で売買アルゴリズムを開発してみたのでその内容を基に Qiita にまとめます。
Quantopian とは
-
米国株式投資のシステムトレードプラットフォームです。Python でシステムトレードアルゴリズムを実装することができるようです。
-
コンテストも行われていて、賞金も用意されているようです。
-
詳細については @sawadybomb 3 の記事 クラウドベースのアルゴリズムトレーディングサービス"Quantopian"を試してみる や 公式ページ を参照下さい

ボリンジャーバンド とは
ボリンジャーバンドとは、移動平均線をさらに進化させたもので、株価の上昇トレンドや下降トレンドの始まりがわかったり、買い過ぎや売られ過ぎのサインが判断しやすい便利な指標です。
自分の理解としては、株価が下がりすぎた時を検出した場合は買い、逆の場合は売り、というのを行う、という戦略で使われる投資指標です。
開発したアルゴリズム
import numpy as np
import talib as ta

def initialize(context):
    """
    initialize() is called once at the start of the program. Any one-time
    startup logic goes here.
    """

    # 銘柄を指定
    # An assortment of securities from different sectors:
    # MSFT, UNH, CTAS, JNS, COG
    context.security_list = [sid(5061), sid(7792), sid(1941), sid(24556), sid(1746)]

    # Rebalance every Monday (or the first trading day if it's a holiday)
    # at market open.
    schedule_function(compute_weights,
                      date_rules.every_day(),
                      time_rules.market_open())

    # Record variables at the end of each day.
    schedule_function(record_vars,
                      date_rules.every_day(),
                      time_rules.market_close())

def compute_weights(context, data):
    """
    Compute weights for each security that we want to order.
    """

    # Get the 30-day price history for each security in our list.
    hist = data.history(context.security_list, 'price', 30, '1d')

    # Create 10-day and 30-day trailing windows.
    prices = hist[-1:]
    prices_10 = hist[-10:]

    upperband = {}
    middleband = {}
    lowerband = {}

    try:
      # 各銘柄に対してボリンジャーバンド値の算出と、約定
      for sym in context.security_list:
        # log.info(sym)
        upperband[sym], middleband[sym], lowerband[sym] = ta.BBANDS(prices_10[sym].values.astype(np.double), timeperiod=10, nbdevup=2, nbdevdn=2, matype=0)

        # log.info(upperband[sym][-1])
        # log.info(lowerband[sym][-1])
        # log.info(prices[sym][-1])

        # ボリンジャーバンド上端値を超えたら
        if upperband[sym][-1] < prices[sym][-1]:
            order_target_percent(sym, -0.20) # 所持金の20%ショート
        # ボリンジャーバンド下端値を下回ったら
        if lowerband[sym][-1] > prices[sym][-1]:
            order_target_percent(sym, 0.20) # 所持金の20%ロング

    except:
      pass

def record_vars(context, data):
    """
    This function is called at the end of each day and plots our leverage as well
    as the number of long and short positions we are holding.
    """

    # Check how many long and short positions we have.
    longs = shorts = 0
    for position in context.portfolio.positions.itervalues():
        if position.amount > 0:
            longs += 1
        elif position.amount < 0:
            shorts += 1

    # Record our variables.
    record(leverage=context.account.leverage, long_count=longs, short_count=shorts)
バックテスト結果(2016/01/01 ~ 2016/12/31)
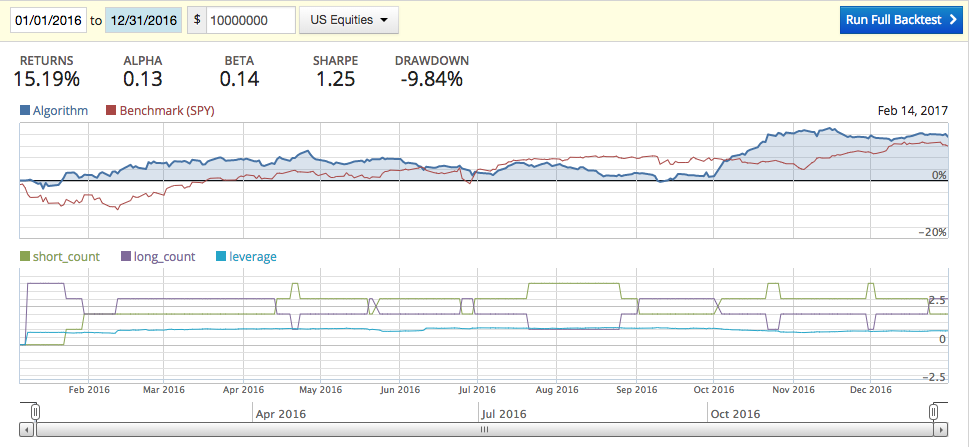
ドローダウンは大きいけど、return はまずまず・・・?
銘柄やパラメータ、他の TA-lib ライブラリを利用して色々なアルゴリズムを作っていきたいです。
ちなみに、フルバックテストをやってみた結果はこちら。
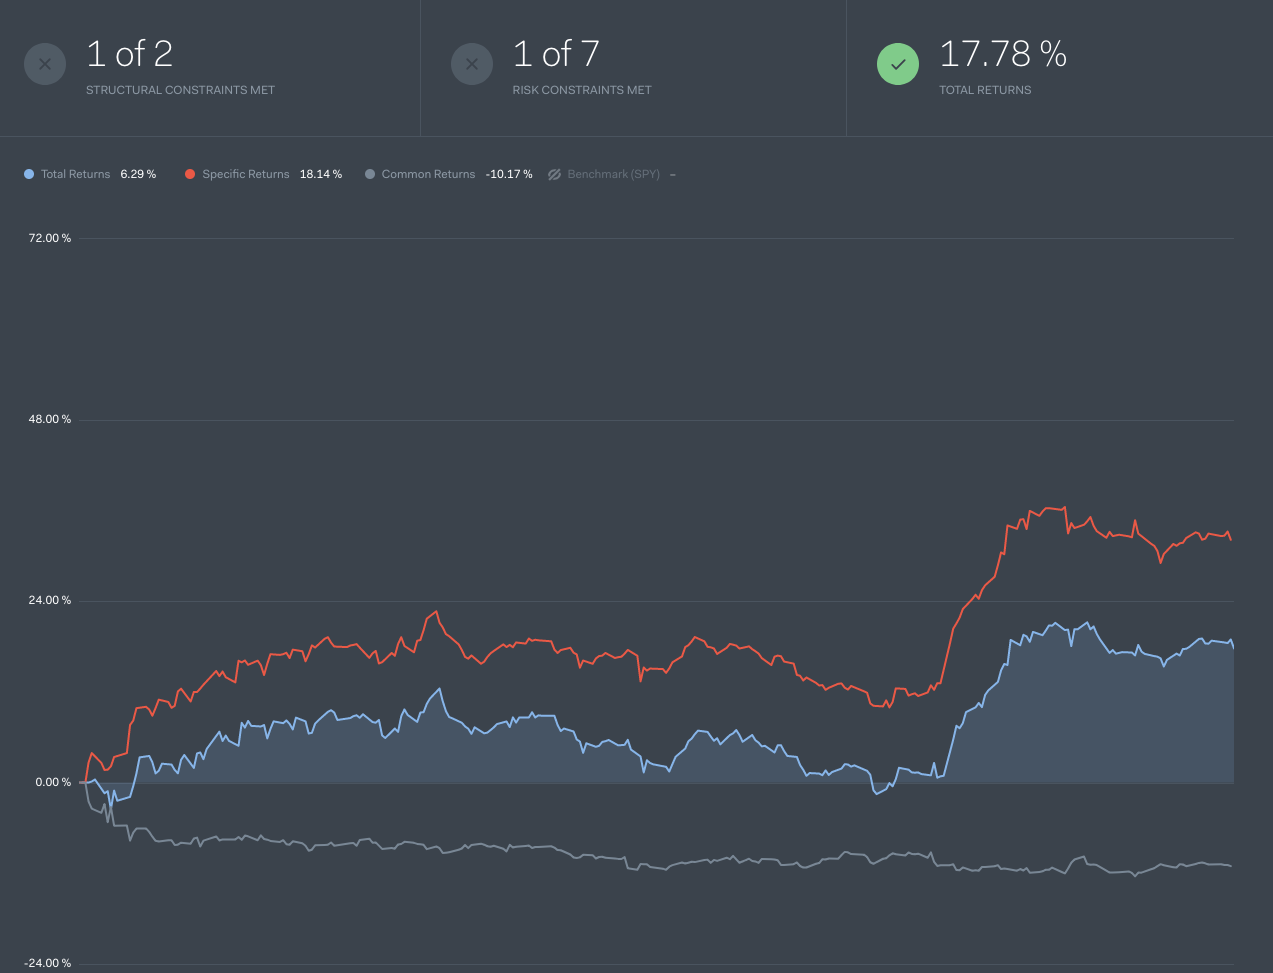
Stracture と Risk が基準値に達してないのでコンテストには応募出来ないよとのこと。これについてはブラッシュアップしていきたいです。