はじめに
AppSheetはGoogleスプレッドシートをベースに業務アプリを開発するのにとても便利なノーコード開発ツールですが、ビュー画面を自由自在にカスタマイズ…というわけにはいかないところが歯がゆく感じられることも多いです。
少しでもビュー画面の表現の幅を広げるために、image型のカラムに表示させる画像を工夫したい。そんなとき、AppSheetクリエーターコミュニティのフォーラムに「Dynamic SVG graphics」という投稿を見つけました。
Dynamic SVG graphics (AppSheet Creators Community)
投稿者のJonathonさんのアイデアは、image型のカラムにSVG形式で画像を記録すれば、データと連動した画像を生成して表示できるというものでした。
SVG形式で円グラフを描く
そのアイデアを起点にリプライでMike_Aさんが円グラフの描き方をまとめてくださって、いい感じに表示するコードを提供してくれてます。
それにテキスト表示も追加して、サイズなんかアレンジしてしまいましたが、60%の円グラフを描くコードがこちらです。
<svg xmlns="http://www.w3.org/2000/svg" viewBox="0 0 200 200">

  <!-- 背景のGrey円 -->
  <circle
    cx="100" cy="100" r="80" fill="none" stroke="lightgrey"
    stroke-width="30"
  />

  <!-- 前景のNavy円 -->
  <circle
    cx="100" cy="100" r="80" fill="none" stroke="Navy"
    stroke-width="30"
    stroke-dasharray="502.65"
    stroke-dashoffset="201.06"
    transform="rotate(-90 100 100)"
  />
  <!--  stroke-dashoffset = 502.65 × (1 - 割合)  -->

  <!-- テキスト表示 -->
  <text fill="Navy" font-family="sans-serif" font-size="300%" font-weight="bold" x="50" y="115">60%</text>
</svg>
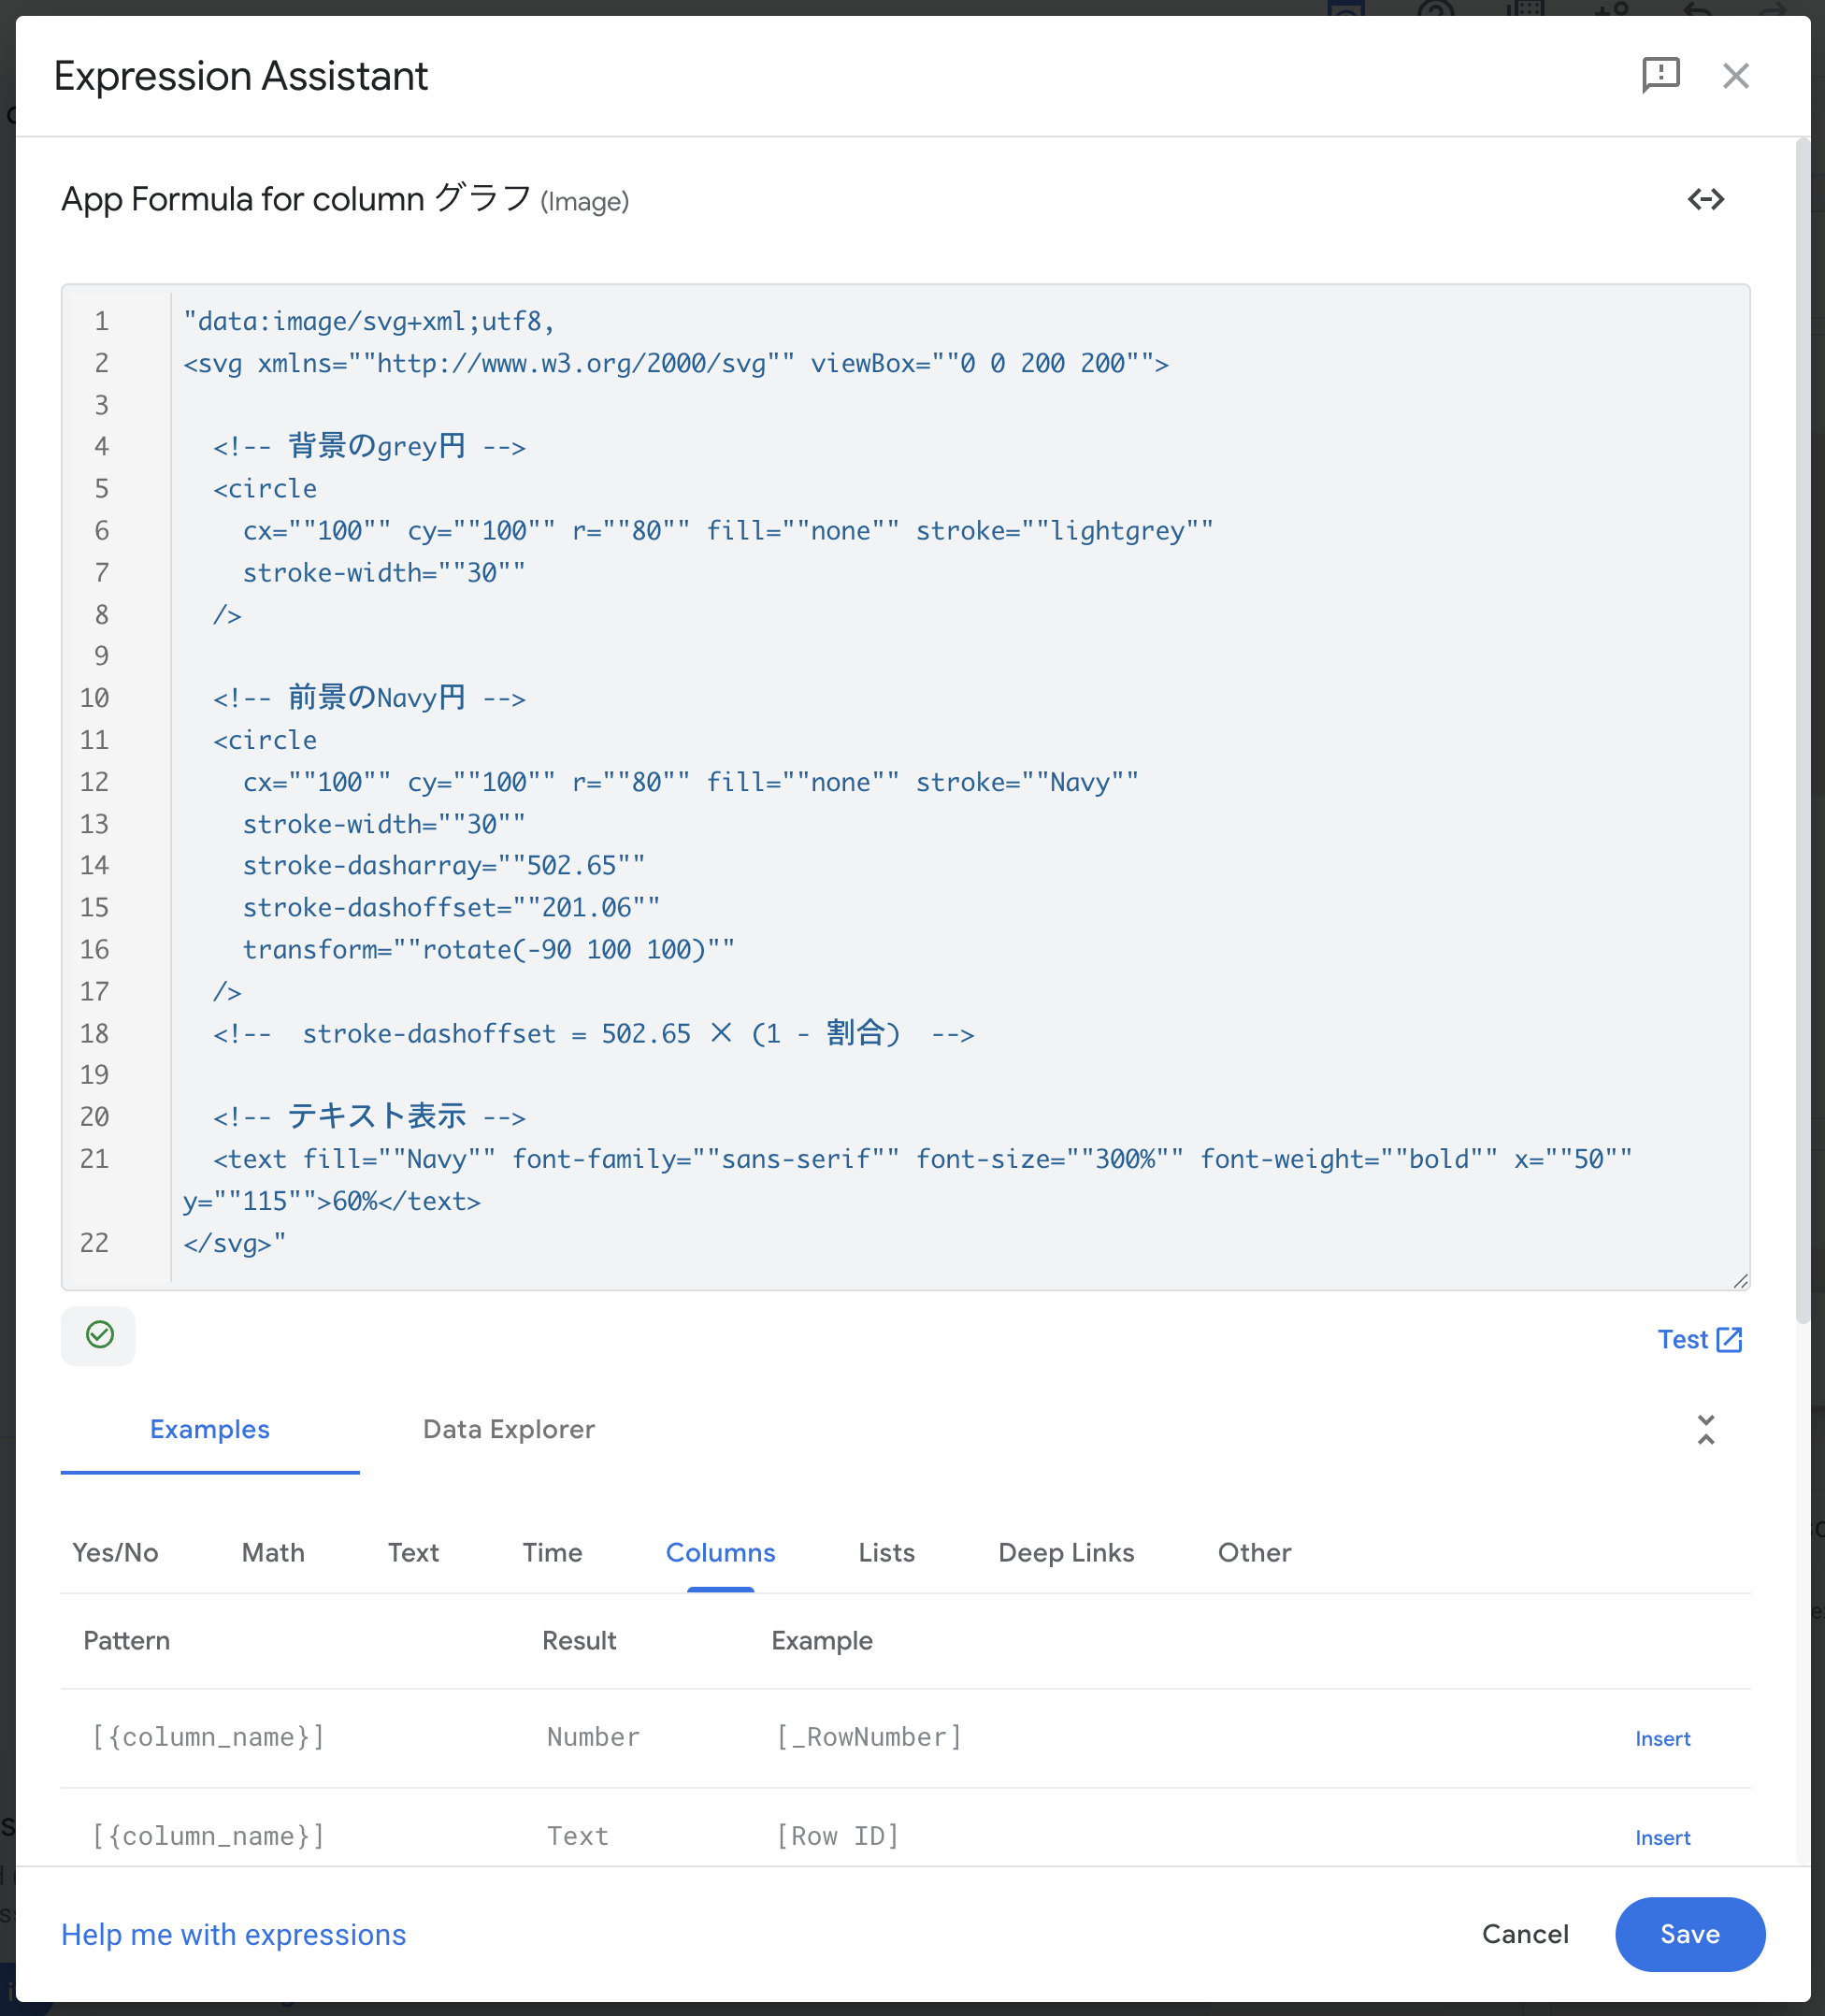
これを実際のデータベース内のカラムにあるFormulaのExpression Assistantに入力する際には「data:image/svg+xml;utf8,」という文言を付加して、ダブルクォーテーションを二重にしなければならないところがあり少々面倒です。(たぶんよい方法がありますけれど、それは後日)以下のコードをコピペしてください。
"data:image/svg+xml;utf8,
<svg xmlns=""http://www.w3.org/2000/svg"" viewBox=""0 0 200 200"">

  <!-- 背景のGrey円 -->
  <circle
    cx=""100"" cy=""100"" r=""80"" fill=""none"" stroke=""lightgrey""
    stroke-width=""30""
  />

  <!-- 前景のNavy円 -->
  <circle
    cx=""100"" cy=""100"" r=""80"" fill=""none"" stroke=""Navy""
    stroke-width=""30""
    stroke-dasharray=""502.65""
    stroke-dashoffset=""201.06""
    transform=""rotate(-90 100 100)""
  />
  <!--  stroke-dashoffset = 502.65 × (1 - 割合)  -->

  <!-- テキスト表示 -->
  <text fill=""Navy"" font-family=""sans-serif"" font-size=""300%"" font-weight=""bold"" x=""50"" y=""115"">60%</text>
</svg>"
結果はこんな感じです。

もしも他のパーセンテージで描画したい場合は、stroke-dashoffsetの数値を変更し、テキスト表示の文字を変更します。
たとえば30%(割合0.3)ならば…
stroke-dashoffset = 502.65 × (1 - 0.3) = 351.855
となります。
動きのある円グラフを描く
冒頭のクリエーターフォーラムのやりとりでは、プログレスバーをSVG形式で表現するための参考となるウェブサイトも紹介されていました。
Animated SVG Radial Progress Bars
これを参考にすればグラフの描画時に動きを付けられそうでした。
こういうときは生成AIの助けを借りて、これらの情報を盛り込んだSVG形式のコードを作ってもらうのが一番です。
<svg xmlns="http://www.w3.org/2000/svg" viewBox="0 0 200 200">

  <style>
    .circle-bg {
      stroke: lightgrey;
    }
    .circle-meter {
      stroke: navy;
      stroke-dasharray: 502.65;
      stroke-dashoffset: 502.65;
      animation: draw 1s ease-out forwards;
    }
    @keyframes draw {
      to {
        stroke-dashoffset: 201.06; /* こちらを変更 */
      }
    }
  </style>

  <!-- 背景のGrey円 -->
  <circle
    class="circle-bg"
    cx="100" cy="100" r="80" fill="none"
    stroke-width="30"
  />

  <!-- 前景のNavy円(アニメーション付き)-->
  <circle
    class="circle-meter"
    cx="100" cy="100" r="80" fill="none"
    stroke-width="30"
    transform="rotate(-90 100 100)"
  />

  <!-- 中央のテキスト -->
  <text fill="Navy" font-family="sans-serif" font-size="240%" font-weight="bold" text-anchor="end" x="155" y="113">60%</text>
</svg>
これで出だし1回だけ動きのある描画が行なわれます。あとはキャッシュされちゃうので、コードが書き変わるまで静止したグラフですけれど。
他のカラムの数値と連動した円グラフを描く
さて、長い前置きを経て、ようやく一番やりたかったことへ。他のカラム(ここではdecimal型)の数値をもとに円グラフとテキストを描画するSVG形式のコードをExpression Assistantに貼り込む形で記述しましょう。
Decimal型のカラムは[Percentage]というカラム名にしたとします。
if(ISBLANK([Percentage]),
"",
CONCATENATE(
"data:image/svg+xml;utf8,",
"<svg xmlns=""http://www.w3.org/2000/svg"" viewBox=""0 0 200 200"">

  <style>
    .circle-bg {
      stroke: lightgrey;
    }
    .circle-meter {
      stroke: navy;
      stroke-dasharray: 502.65;
      stroke-dashoffset: 502.65;
      animation: draw 1s ease-out forwards;
    }
    @keyframes draw {
      to {
        stroke-dashoffset: ",
        TEXT(502.65 * (1 - [Percentage] / 100)), ";
      }
    }
  </style>

  <!-- 背景のGrey円 -->
  <circle
    class=""circle-bg""
    cx=""100"" cy=""100"" r=""80"" fill=""none""
    stroke-width=""30""
  />

  <!-- 前景のNavy円(アニメーション付き)-->
  <circle
    class=""circle-meter""
    cx=""100"" cy=""100"" r=""80"" fill=""none""
    stroke-width=""30""
    transform=""rotate(-90 100 100)""
  />

  <!-- 中央のテキスト -->
  <text fill=""Navy"" font-family=""sans-serif"" font-size=""240%"" font-weight=""bold"" text-anchor=""end"" x=""155"" y=""113"">",
  [Percentage], "%", "</text>
</svg>"
))
[Percentage]が空であれば、image型のカラムも空っぽ("")にします。[Percentage]の数値があれば、その数値をもとに計算して描画されます。たとえばフォームビューで見るとこんな感じです。
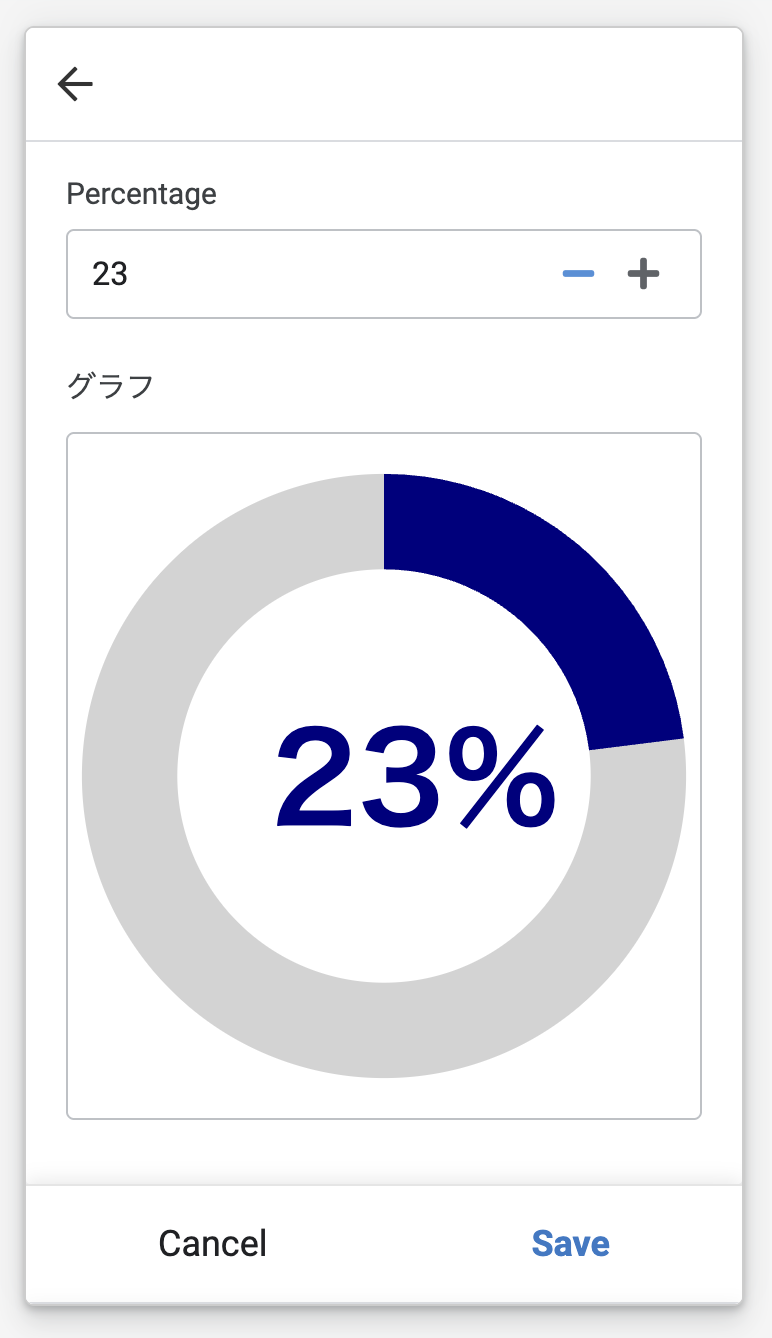
フォームビューでimage型カラムを表示していると、数値に連動してリアルタイムに描画されるのですが、そこでアニメーションが済んでしまって、実際の閲覧画面ではアニメーションしてくれないかもしれません。ちょっと寂しいですが…。
注意点
これもフォーラムのやりとりで書かれていたことですが、SVG内で色を指定するとき、「#」(ハッシュタグ)記号を使った色指定表記だとAppSheetでエラーになってしまいます。それ以外の色指定方法を試してください。
(追記)棒グラフの場合
<svg xmlns="http://www.w3.org/2000/svg" viewBox="0 0 200 20" width="200" height="30">
  <style>
    .bg {
      stroke: lightgray;
      stroke-width: 30;
      fill: none;
    }

    .meter {
      stroke: Navy;
      stroke-width: 30;
      fill: none;
      stroke-dasharray: 200;
      stroke-dashoffset: 200;
      animation: fill-bar 1s ease-out forwards;
    }

    @keyframes fill-bar {
      to {
        stroke-dashoffset: calc(200 - (70 * 2));
        /* stroke-dashoffset = calc(200 - (percentage * 2)) */
      }
    }
  </style>
  <path class="bg" d="M0 10 L200 10" />
  <path class="meter" d="M0 10 L200 10" />
</svg>