Amazon: イラストで学ぶ 機械学習 最小二乗法による識別モデル学習を中心にを読み進めています。
出典: Amazon
今回は第3章〜第5章の最小二乗学習による回帰分析をpythonとsckit-learnで実装してみます。利用環境は以下の通りです。
- anaconda3-2.5.0
- scikit-learn (0.17.1)
データを用意する
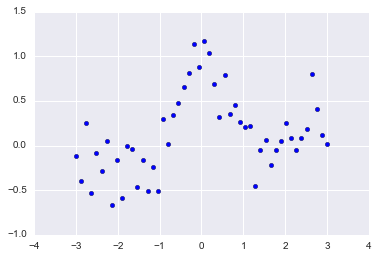
右肩上がりのトレンド(第二項)に周期変動(第一項)とノイズ(第三項)が乗っているというデータを用意します。本に比べてノイズパラメタを増やしています。
import numpy as np
import matplotlib.pyplot as plt

%matplotlib inline

n = 50; N = 1000

x = np.linspace(-3, 3, n)
X = np.linspace(-3, 3, N)

pix = np.pi * x
y = np.sin(pix) / pix + 0.1 * x + 0.2 * np.random.randn(n)

x = x.reshape(-1, 1)
X = X.reshape(-1, 1)
y = y.reshape(-1, 1)

plt.scatter(x,y)
LinearRegression
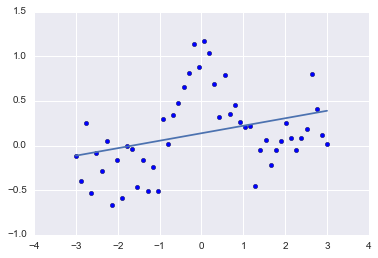
何も制約が付かないプレーンな線形モデルであるsklearn.linear_model.LinearRegressionを利用して、フィッティングしてみます。
from sklearn.linear_model import LinearRegression

clf = LinearRegression()
clf.fit(x, y)

p = clf.predict(X)

plt.scatter(x, y)
plt.plot(X,p)

print(clf.score(x, y))
なんとなく右肩上がりのトレンドは見えますが、決定係数(coefficient of determination)は0.10と低いです。
KernelRidge
周期的に変動するデータは線形モデルと相性が悪いので、次はガウスカーネルモデルを利用します。
お手軽にやるならsklearn.kernel_ridge.KernelRidge がよさそうです。
Kernel ridge regression (KRR) combines ridge regression (linear least squares with l2-norm regularization) with the kernel trick. It thus learns a linear function in the space induced by the respective kernel and the data. For non-linear kernels, this corresponds to a non-linear function in the original space.
英文の説明そのままですが、Kernel Ridge Regression は l2制約付き最小二乗学習(linear least squares with l2-norm regularization)です。
from sklearn.kernel_ridge import KernelRidge

clf = KernelRidge(alpha=1.0, kernel='rbf')
clf.fit(x, y)

p = clf.predict(X)

plt.scatter(x, y)
plt.plot(X, p)

print(clf.score(x, y))
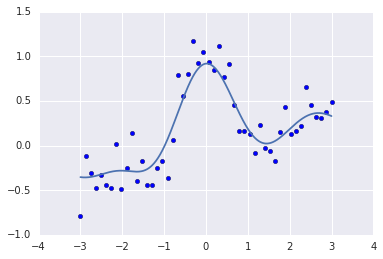
決定係数は0.81で、線形モデルから大幅に改善しました。
余談ですが、ドキュメントがなかなか見つからずに苦労しました ^^
https://github.com/scikit-learn/scikit-learn/blob/51a765a/sklearn/kernel_ridge.py#L120-L121 を追っていくと、kernelに'rfb'を指定できることがわかります。
KernelRidgeを使わない最小二乗学習
KernelRidgeを使わずに、RBFカーネルによる最小二乗学習を実行することもできます。
sklearn.linear_model.LinearRegression
まず制約を何も付けずにやってみます。
from sklearn.metrics.pairwise import rbf_kernel

kx = rbf_kernel(x, x)
KX = rbf_kernel(X, x)

clf = LinearRegression()
clf.fit(kx, y)

p = clf.predict(KX)

plt.scatter(x, y)
plt.plot(X, p)

print(clf.score(kx, y))
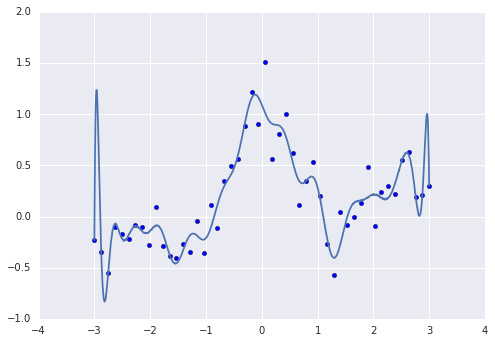
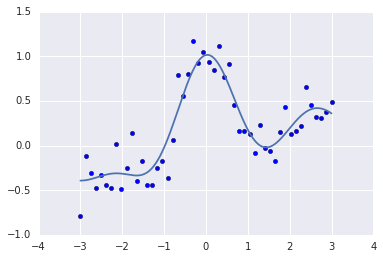
オーバーフィット気味です。
sklearn.linear_model.Ridge
次に、l2制約を入れてみます。
from sklearn.metrics.pairwise import rbf_kernel
from sklearn.linear_model import Ridge

kx = rbf_kernel(x, x)
KX = rbf_kernel(X, x)

clf = Ridge()
clf.fit(kx, y)

p = clf.predict(KX)

plt.scatter(x, y)
plt.plot(X, p)

print(clf.score(kx, y))
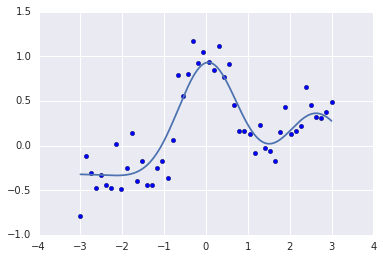
滑らかになりました。
sklearn.linear_model.Lasso
今度はl1制約付き(ラッソ回帰)でやってみます。
from sklearn.metrics.pairwise import rbf_kernel
from sklearn.linear_model import Lasso

kx = rbf_kernel(x, x)
KX = rbf_kernel(X, x)

clf = Lasso(alpha=0.01)
clf.fit(kx, y)

p = clf.predict(KX)

plt.scatter(x, y)
plt.plot(X, p)

print(clf.score(kx, y)) # 0.820550922167
ラッソ回帰はパラメタをスパースにするので、確認してみると...
print(clf.coef_)

[-0.         -0.         -0.         -0.         -0.         -0.         -0.
 -0.         -0.         -0.         -0.         -0.         -0.         -0.
 -0.05432222 -0.         -0.         -0.         -0.         -0.          0.
  0.          0.          0.          0.17642978  1.08522759  0.          0.
  0.          0.          0.         -0.         -0.         -0.         -0.
 -0.         -0.         -0.         -0.          0.          0.          0.
  0.          0.          0.          0.          0.66599521  0.01403876
  0.          0.        ]
期待通り 0 が多くなってます。
sklearn.linear_model.ElasticNet
モデルを挿げ替えるだけですが、一応l1 + l2制約付き(ElasticNet)でやってみます。
from sklearn.linear_model import ElasticNet

kx = rbf_kernel(x, x)
KX = rbf_kernel(X, x)

clf = ElasticNet(alpha=0.01)
clf.fit(kx, y)

p = clf.predict(KX)

plt.scatter(x, y)
plt.plot(X, p)

print(clf.score(kx, y))
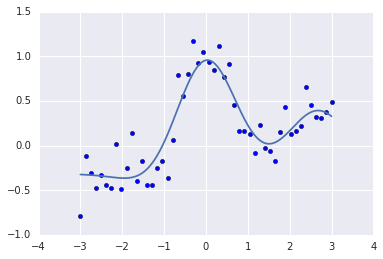
今回の例では目視で確認できるほどの差異はないようです。
まとめ
周期変動するダミーデータを利用して、LinearRegression、Ridge、Lasso、ElasticNet など様々な回帰分析をやってみました。

