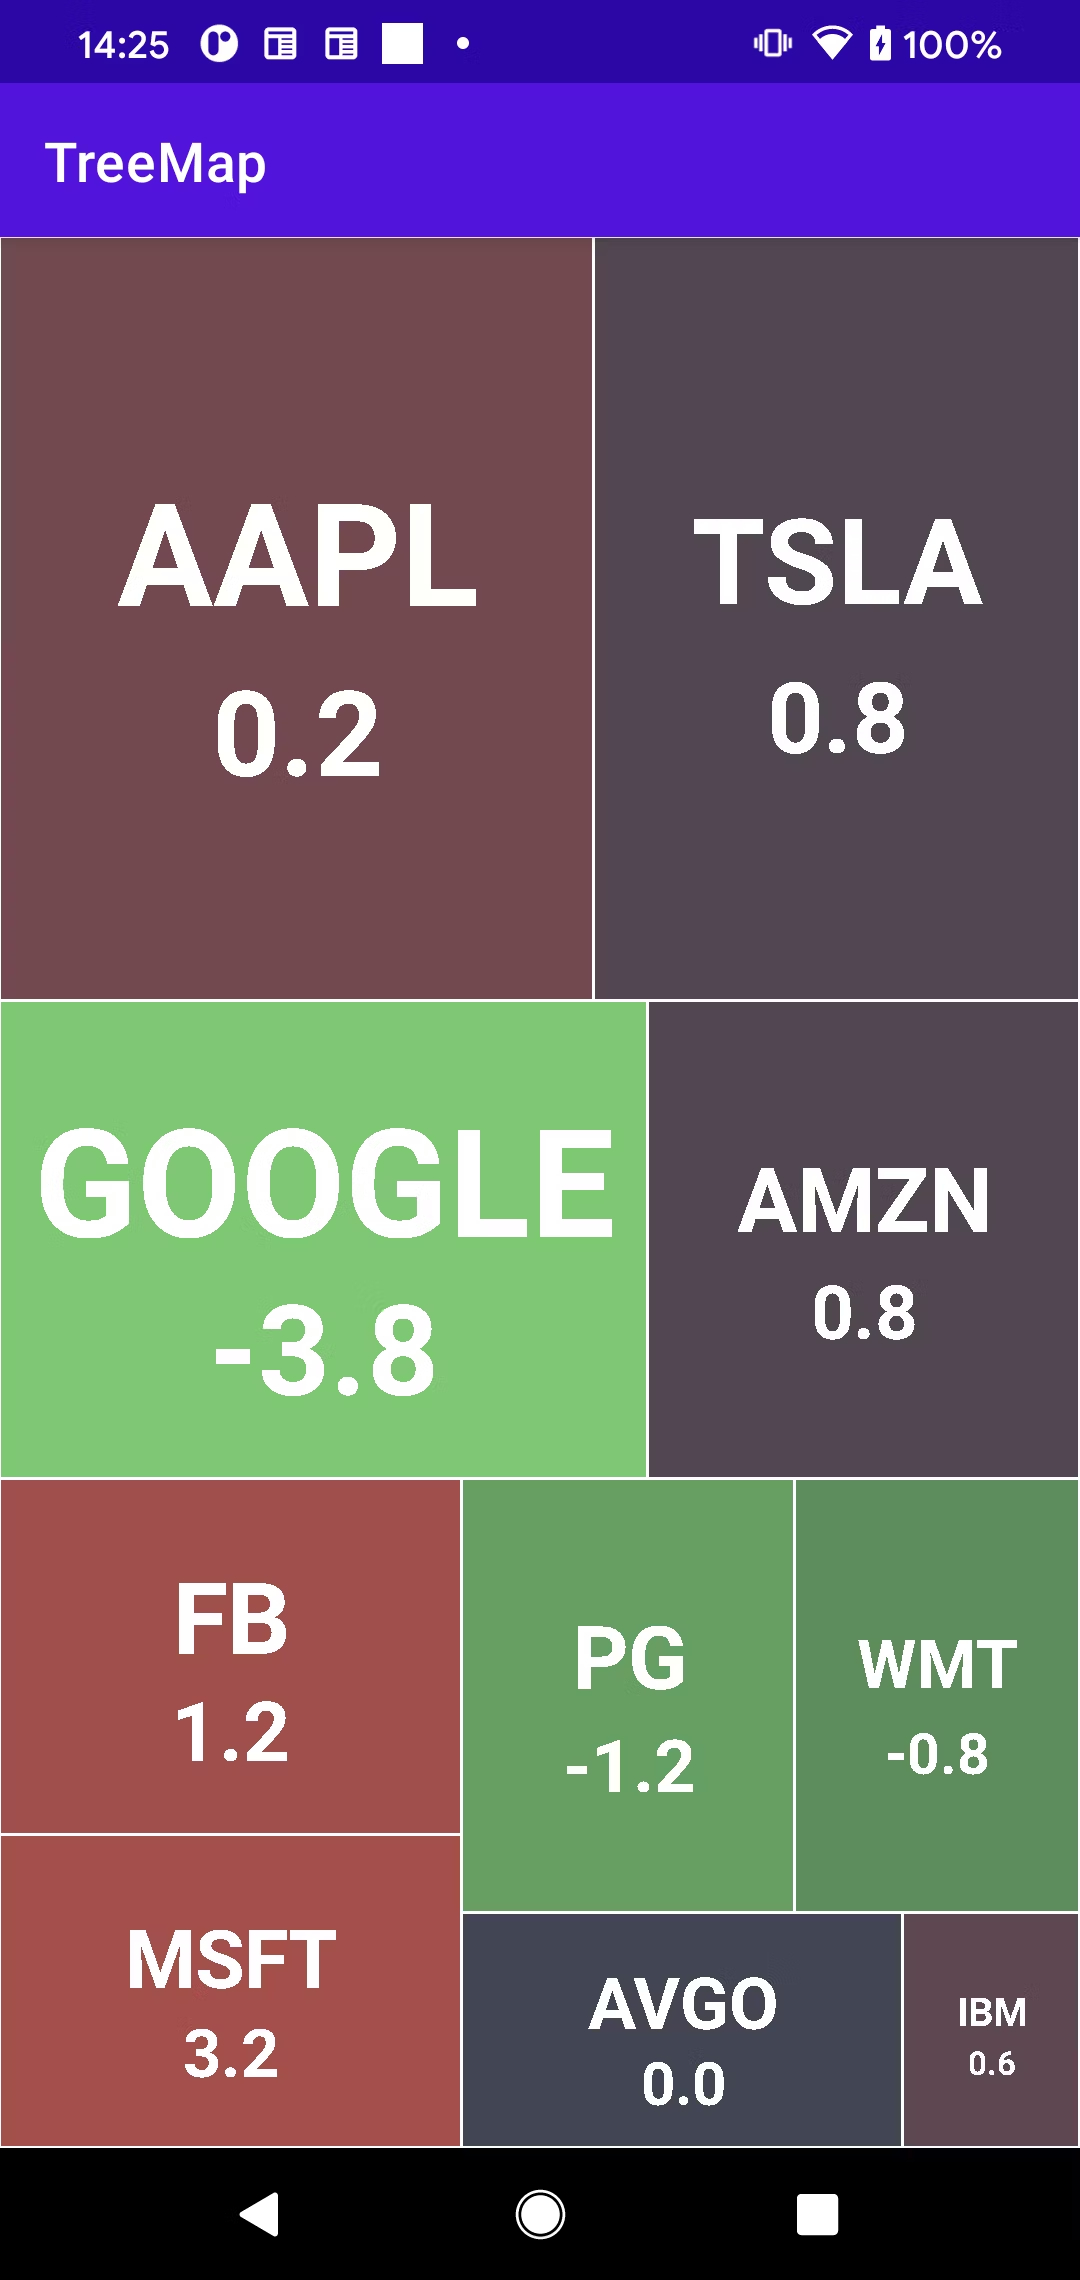
S&P500などでよく見られるヒートマップ。
ネット上に実装方法を解説した記事がほとんどなかったため、なるべく分かりやすく解説したいと思います。
ライブラリは使いません。
ソースコードはGitHubに上げております。
完成形
超ざっくりと実装の流れを説明
- 株価データの作成
- 株価データも基に座標を計算
- 座標データを元にCanvasで描画
実装
まずは株価データ用のデータクラスを作成します
StockData
// 株価データ
data class StockData(
    // 運用額
    var amount:Double,
    // 銘柄名 Ticker symbol
    var name: String,
    // 騰落率
    var changeRate: Double
)
各銘柄の運用額が面積を決定します。
運用額の大きい銘柄は左上に、小さい銘柄は右下に配置されます。
座標データの作成
ここがツリーマップ作成における最も重要な部分です。
何をやっているか
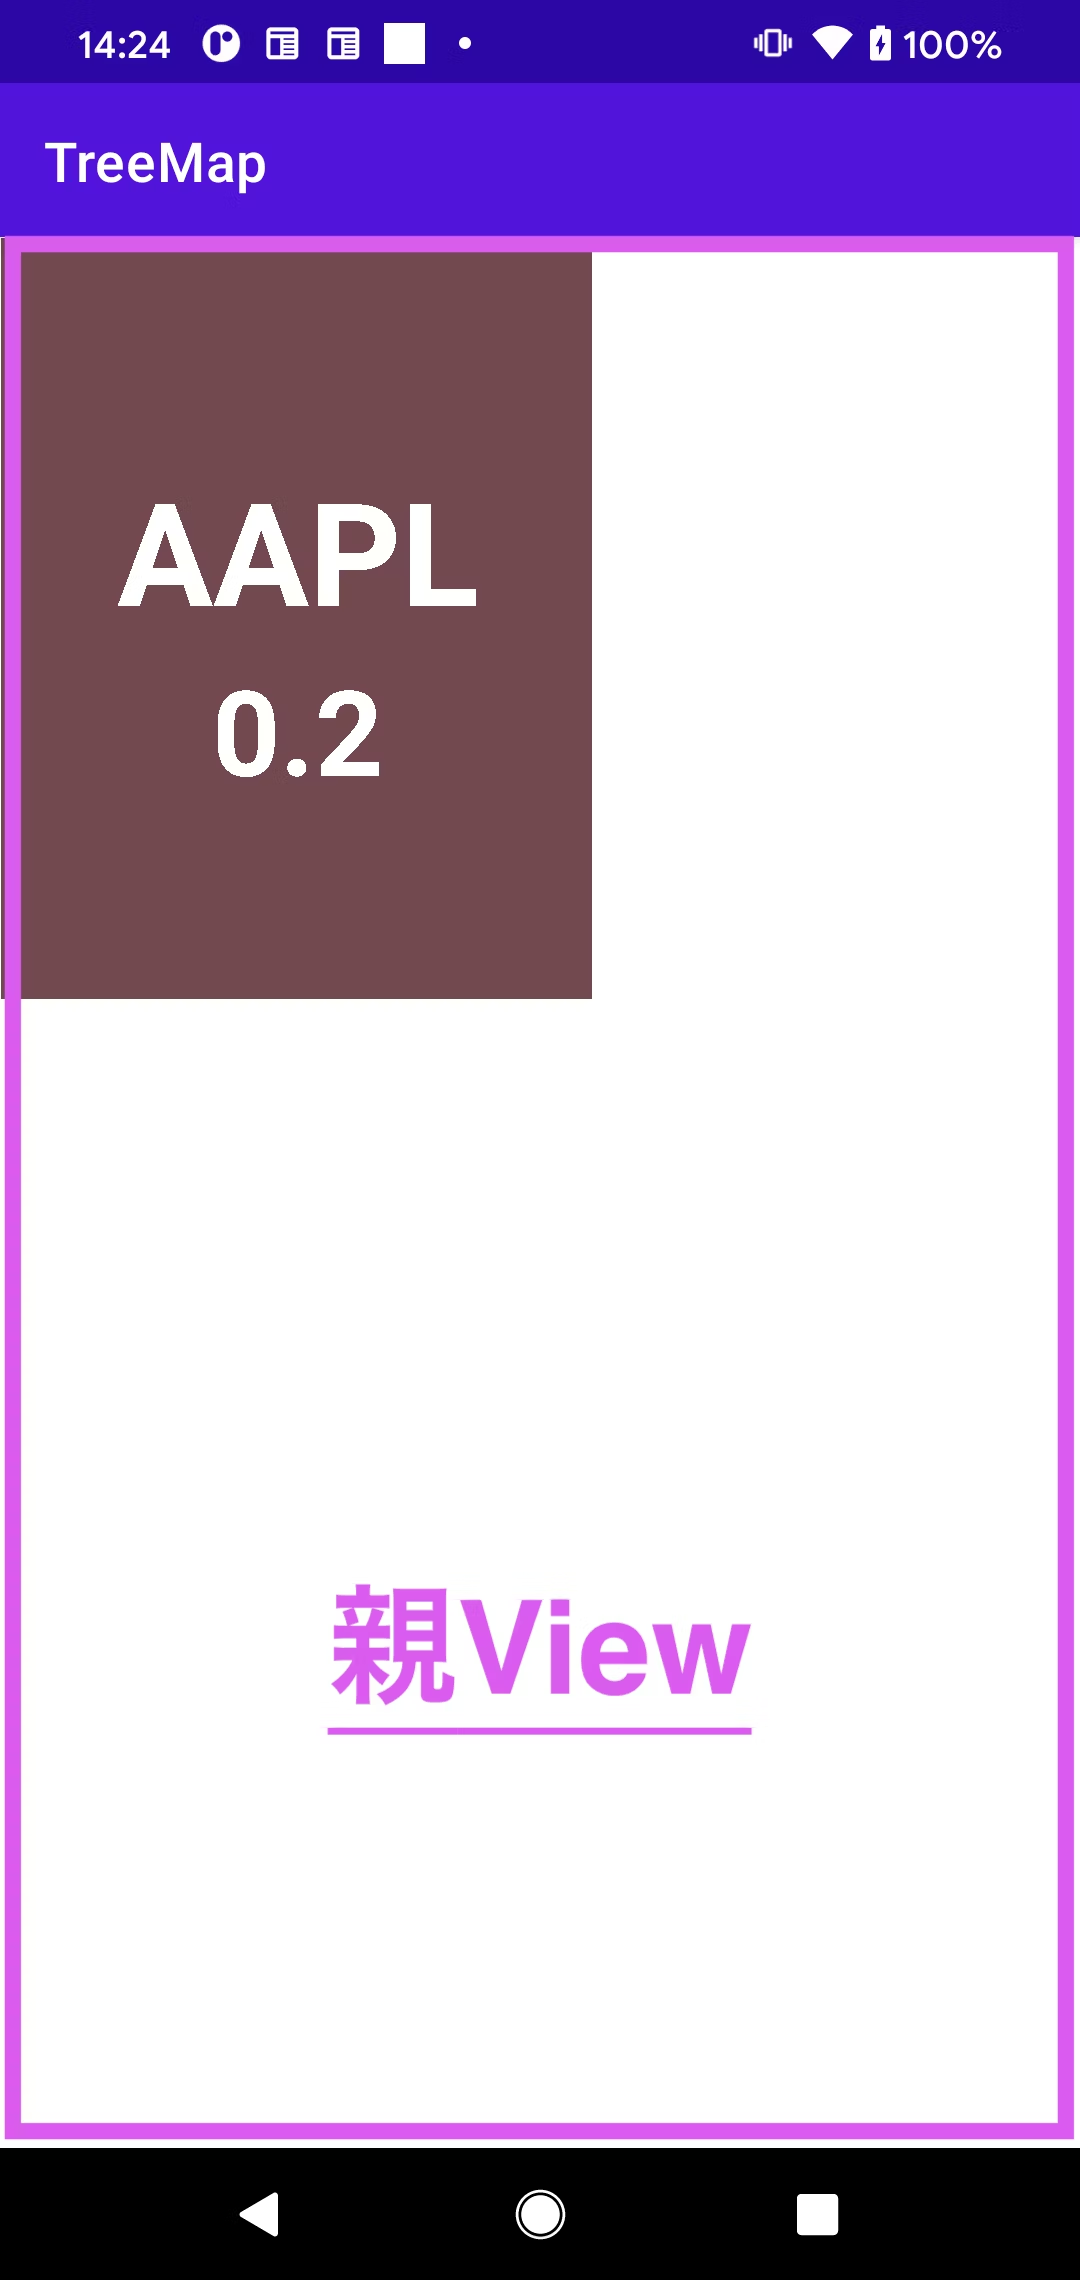
- ツリーマップを描画するコンテナとなるView(以下親View)が縦長か横長かどうかを判定。
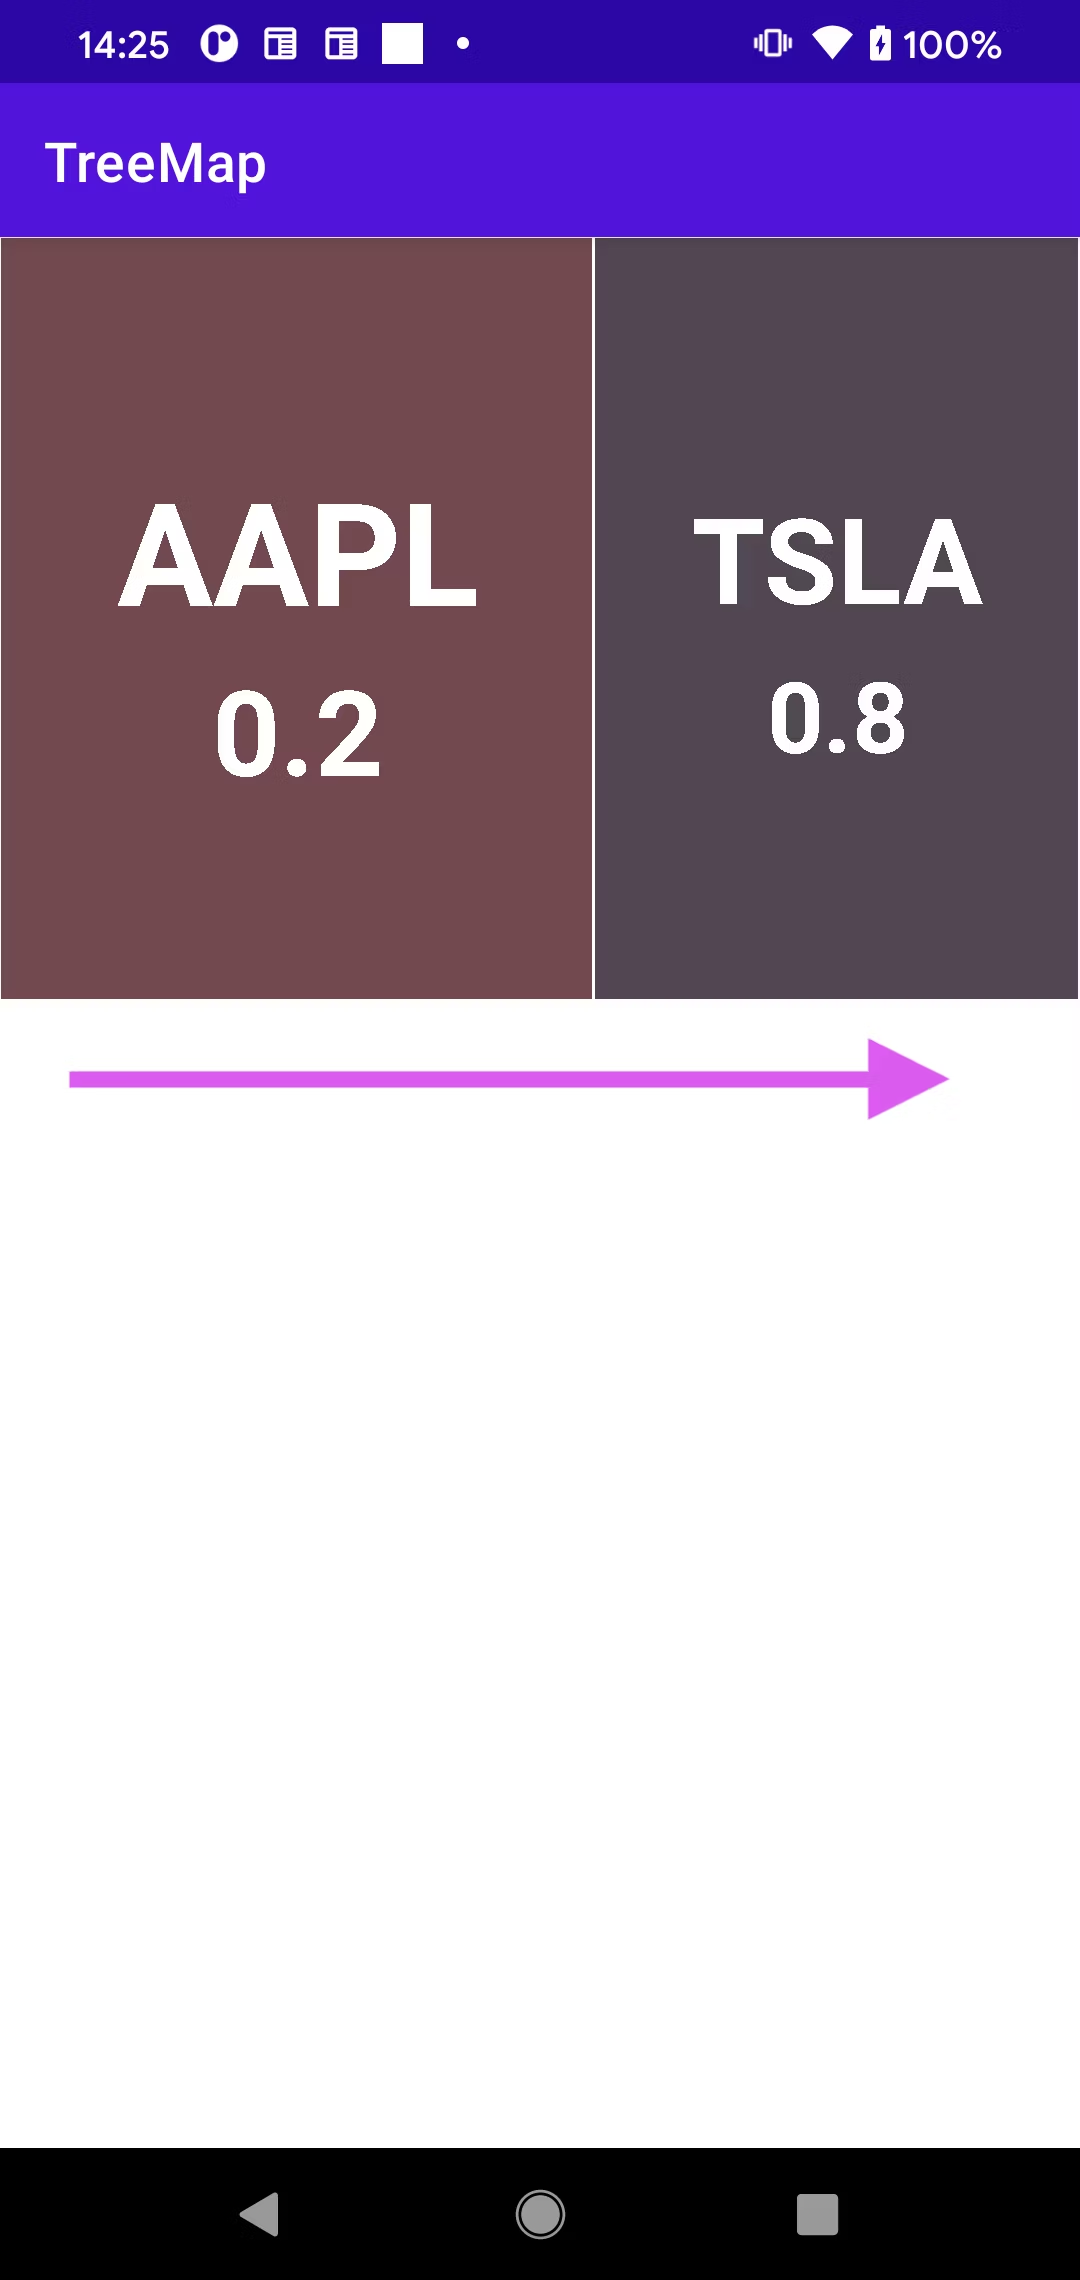
- 縦長であれば横方向に可能な限り銘柄を描画 (逆も然り)。
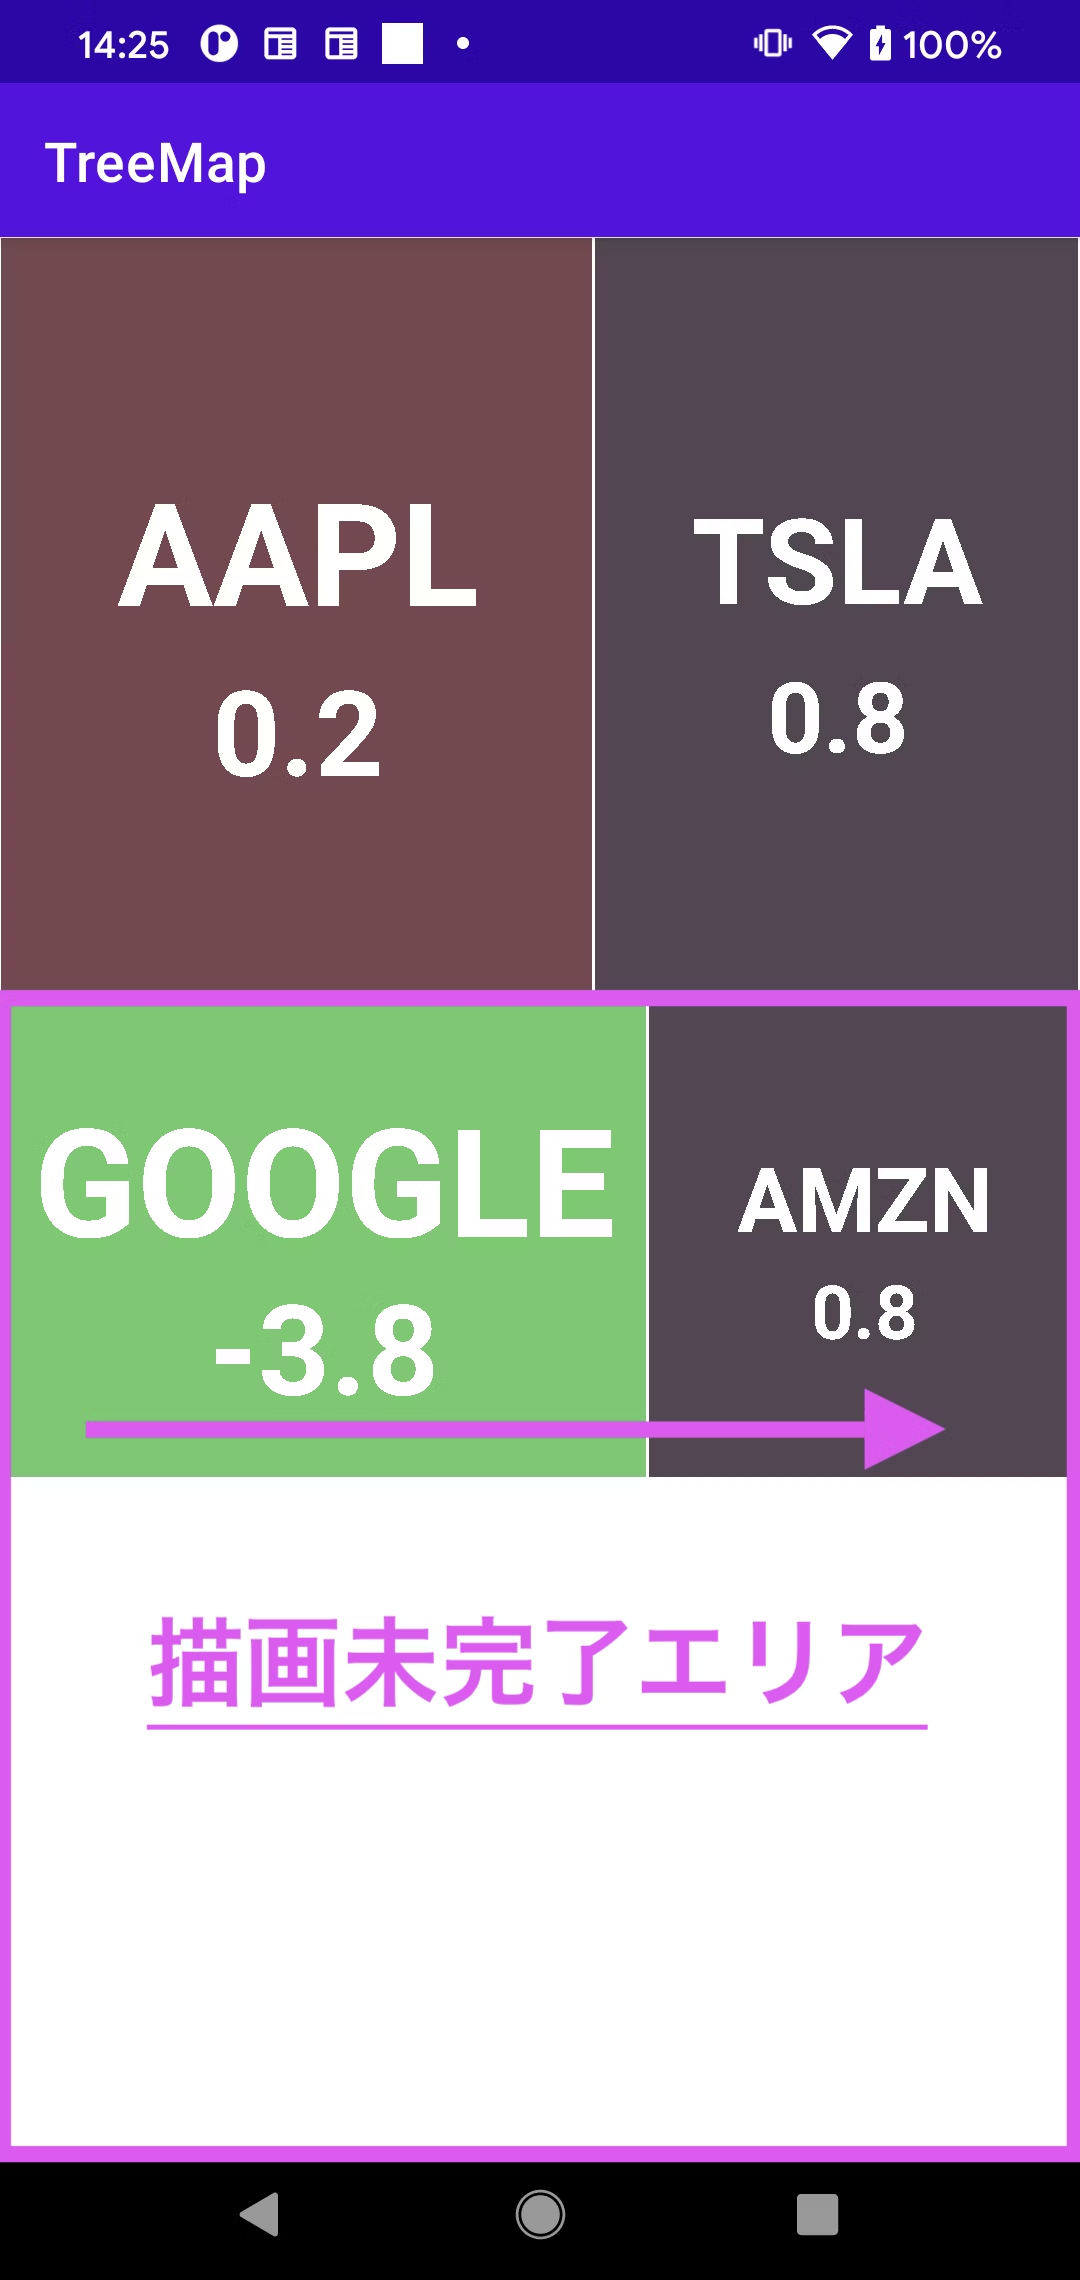
- 描画後、親View内の残りのスペース(以下描画未完了エリア)が縦長か横長かどうかを判定。
- これ以降は2と3を繰り返す。
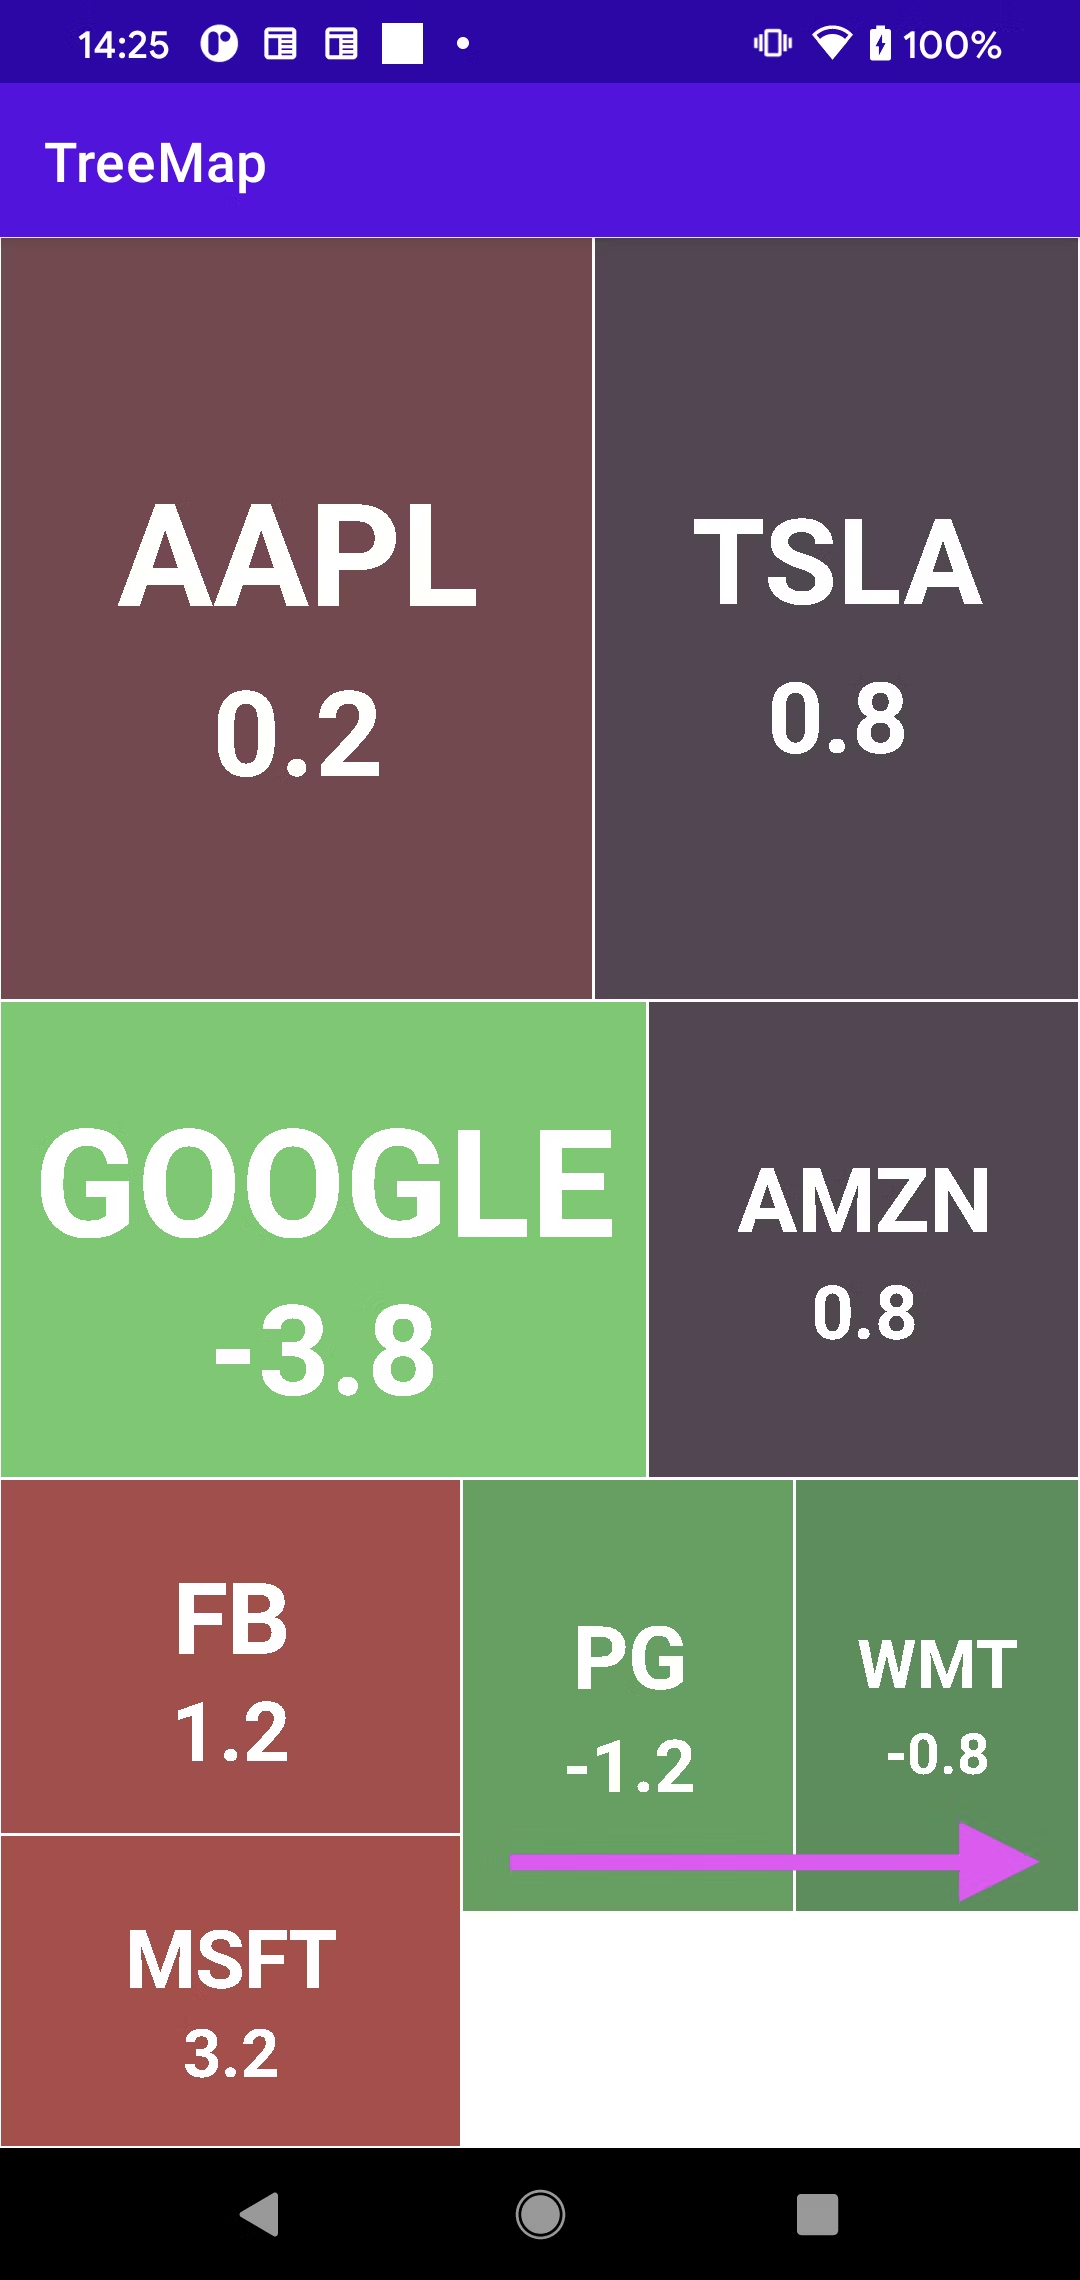
図を使って説明
親Viewは縦長なので、描画方法は横とする。
描画未完了エリアは縦長なので、次の描画方向も横。
描画未完了エリアは横長なので、次の描画方向は縦。
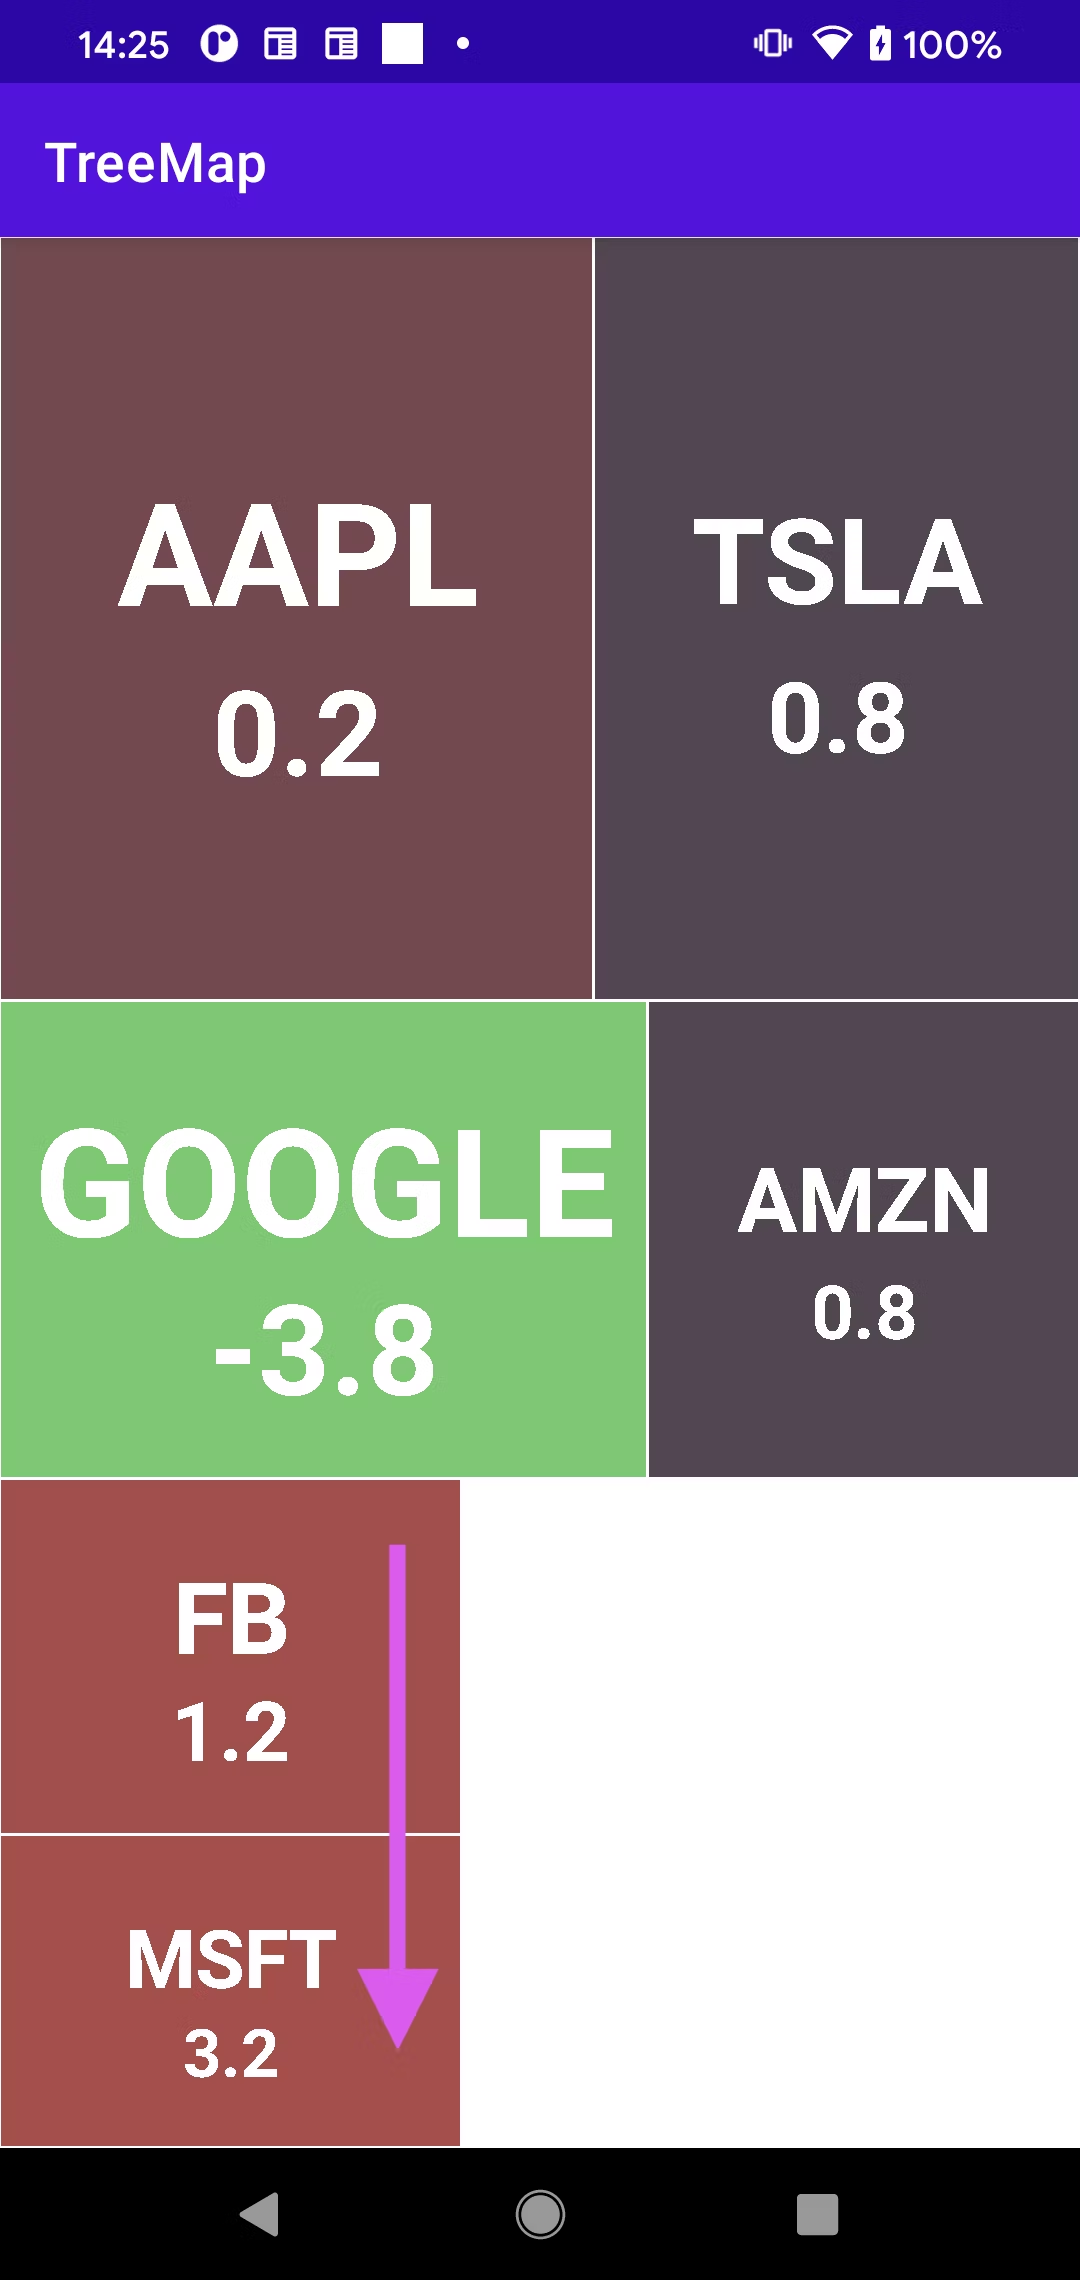
上記と同様に描画を繰り返します。
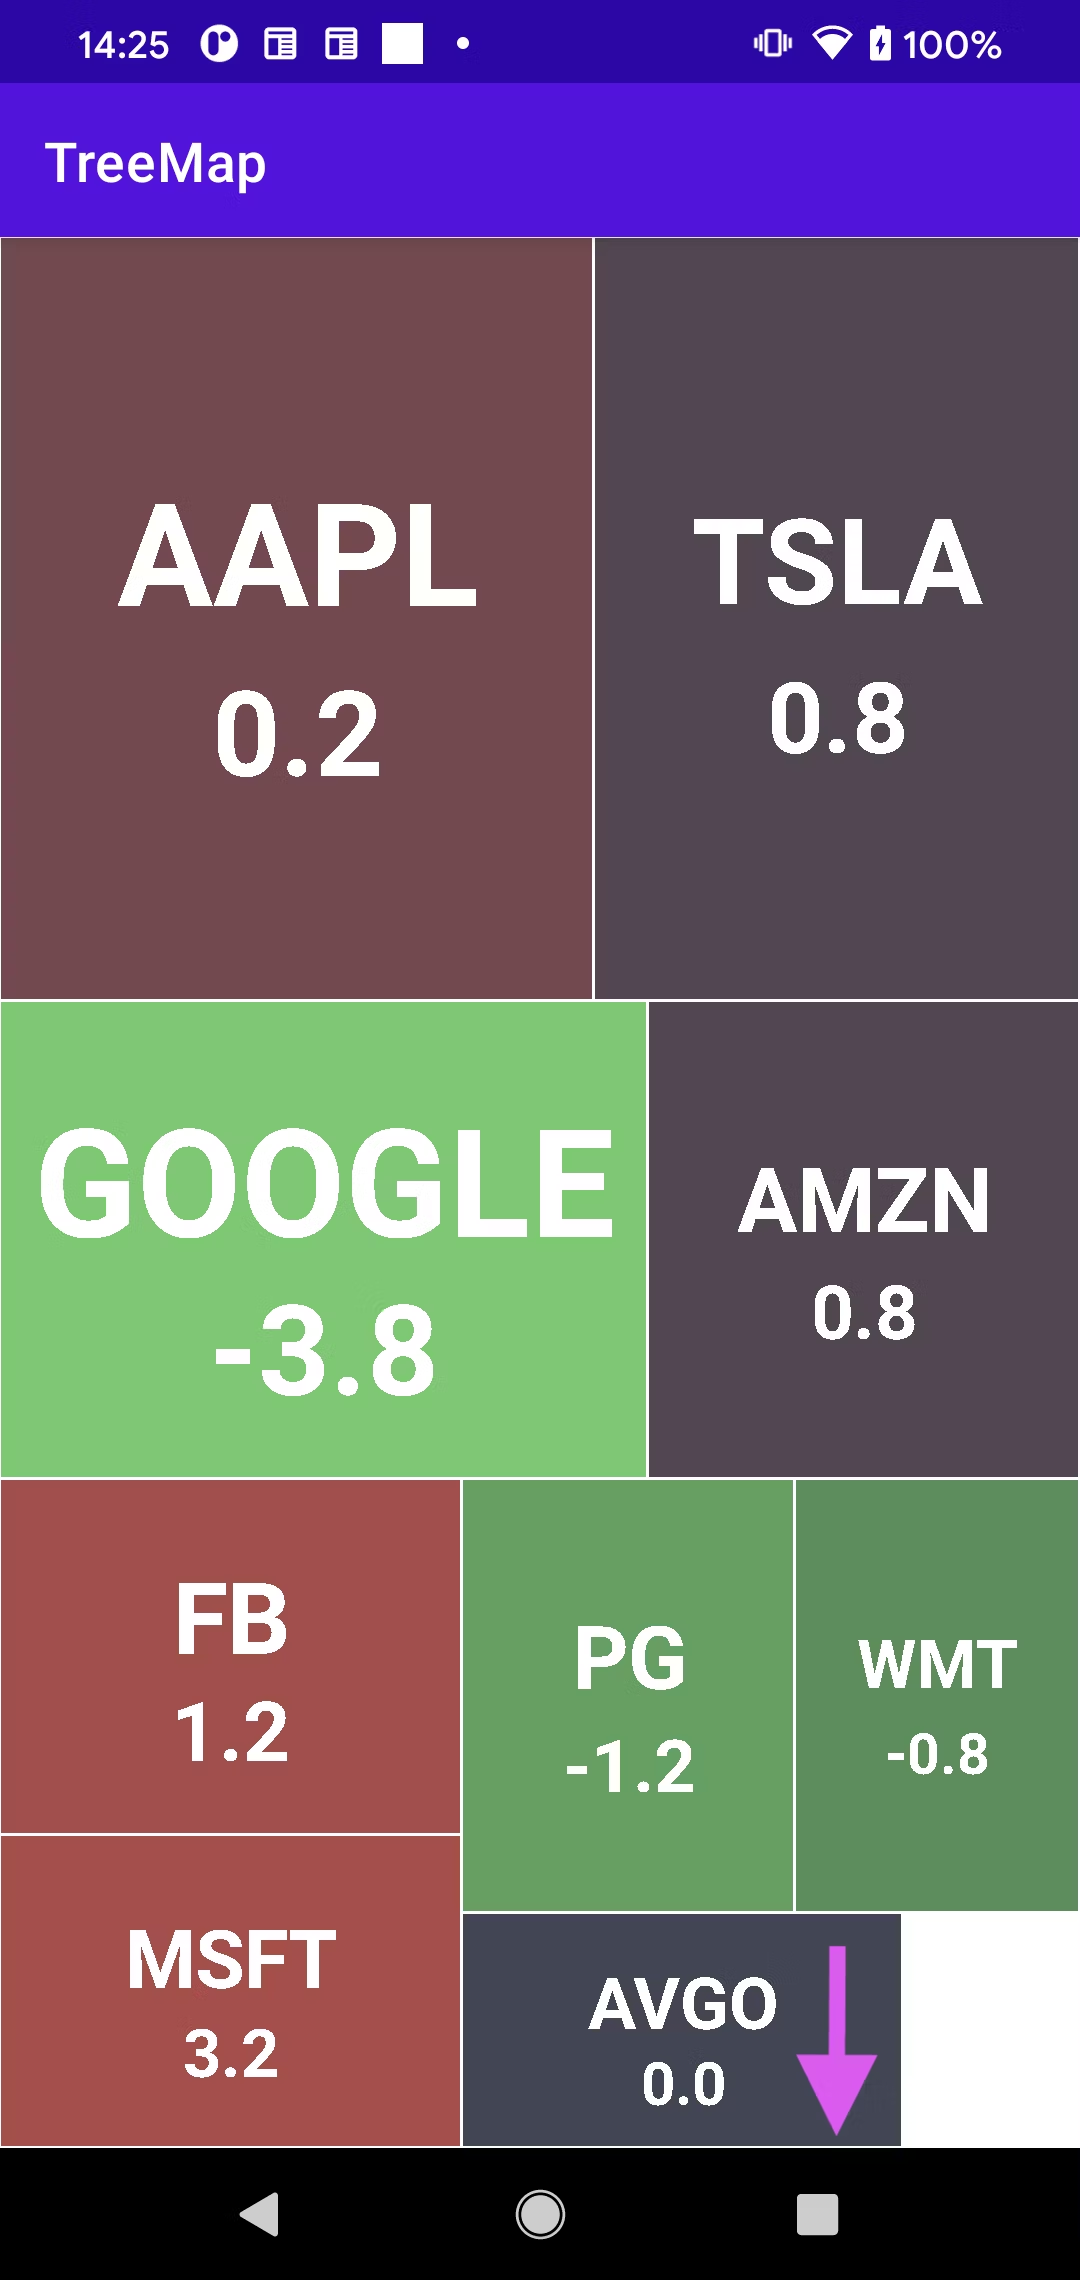
完成
では早速コーディングをしていきましょう。
株価データから座標を作成する
各銘柄の座標と株価データを保持するクラスを作成します。
Coordinate
// 各銘柄の座標と株価データを保持する
data class Coordinate(
    // 座標
    var x: Float,
    var y: Float,
    // 高さ、幅
    var width: Float,
    var height: Float,
    // 運用額や銘柄名等の各銘柄に関する情報
    var data: StockData
)
座標を計算するクラスを作成します。
CalcCoordinate
class CalcCoordinate(stockList: List<StockData>, parentWidth: Float, parentHeight: Float) {
    // 計算未完了エリア
    private var mUnCalcArea: UnCalcArea = UnCalcArea(parentWidth, parentHeight)
    // 銘柄リスト
    private var mStockList: List<StockData> = stockList
    // 計算未完了エリアが縦長であれば、横方向に描画。逆も然り
    // 描画方向の描画幅
    private val mDirectionWidth: Vertical
        get() = if (mUnCalcArea.height.pow(2.0f) > mUnCalcArea.width.pow(2.0f)) {
            Vertical(mUnCalcArea.width, false)
        } else Vertical(mUnCalcArea.height, true)

    init {
        if(!mStockList.isNullOrEmpty()) {
            // 運用額の合計
            var totalValue = 0.0
            mStockList.forEach {
                totalValue += it.amount
            }

            // 各銘柄の全体に対する占有面積を格納したリスト
            val valueRateList = floatArrayOf().toCollection(ArrayList())
            mStockList.forEach {
                valueRateList.add(it.amount.times(parentHeight).times(parentWidth).div(totalValue).toFloat())
            }

            // 座標データの作成
            square(valueRateList.toFloatArray(), floatArrayOf(), mDirectionWidth.value)
        }
    }

    /**
     * @param unCalcStockList 計算未完了銘柄リスト
     * @param rawStocksList  1行で描画する(計算する)銘柄リスト
     * @param directionWidth 描画方向の描画幅
     * */
    private fun square(unCalcStockList: FloatArray, rawStocksList: FloatArray, directionWidth: Float) {
        // 最後の1銘柄の場合の処理
        if (unCalcStockList.size == 1) {
            calcLastRow(rawStocksList, unCalcStockList, directionWidth)
            return
        }

        // drawStocksListに計算未完了銘柄リストの先頭を追加したリストを作成
        val additionalStocksList = FloatArray(rawStocksList.size + 1)
        System.arraycopy(rawStocksList, 0, additionalStocksList, 0, rawStocksList.size)
        additionalStocksList[rawStocksList.size] = unCalcStockList[0]

        // additionalStocksListから、もう1銘柄描画できるかどうかを判定
        if (rawStocksList.isEmpty() || worstRatio(rawStocksList, directionWidth) >= worstRatio(additionalStocksList, directionWidth)) {
            square(unCalcStockList.copyOfRange(1, unCalcStockList.size), additionalStocksList, directionWidth)
            return
        }

        // 1行分の銘柄の座標データを作成
        calcRow(rawStocksList, directionWidth, mDirectionWidth.isVertical)

        // 残りの銘柄を計算
        square(unCalcStockList, floatArrayOf(), mDirectionWidth.value)
    }

    // 面積比と描画方向の描画幅から描画可否の判定に使用する値を算出
    private fun worstRatio(row: FloatArray, directionWidth: Float): Float {
        val sum = row.sum()
        val rowMax = row.maxOrNull() ?:0f
        val rowMin = row.minOrNull() ?:0f
        return (directionWidth.pow(2.0f) * rowMax / sum.pow(2.0f)).coerceAtLeast(
            sum.pow(2.0f) / (directionWidth.pow(2.0f) * rowMin)
        )
    }

    // 1行分の銘柄の座標データを作成
    private fun calcRow(valueRateList: FloatArray, directionWidth: Float, vertical: Boolean) {
        val rowHeight = valueRateList.sum().div(directionWidth)

        valueRateList.forEach {
            val rowWidth = it / rowHeight
            val xBeginning = mUnCalcArea.xBeginning
            val yBeginning = mUnCalcArea.yBeginning
            val data: Coordinate
            if (vertical) {
                data = Coordinate(
                    xBeginning, yBeginning, rowHeight, rowWidth,
                    mStockList[mUnCalcArea.data.size]
                )
                mUnCalcArea.yBeginning += rowWidth
            } else {
                data = Coordinate(
                    xBeginning, yBeginning, rowWidth, rowHeight,
                    mStockList[mUnCalcArea.data.size]
                )
                mUnCalcArea.xBeginning += rowWidth
            }

            // 座標データをここで追加
            mUnCalcArea.data.add(data);
        }

        // 描画した方向を元に次の銘柄の描画開始位置を設定
        if (vertical) {
            mUnCalcArea.xBeginning += rowHeight
            mUnCalcArea.yBeginning -= directionWidth
            mUnCalcArea.width -= rowHeight
        } else {
            mUnCalcArea.xBeginning -= directionWidth
            mUnCalcArea.yBeginning += rowHeight
            mUnCalcArea.height -= rowHeight
        }
    }

    // 最後の1銘柄を計算
    private fun calcLastRow(rawStocksList: FloatArray, unDrawnStockList: FloatArray, width: Float) {
        val vertical = mDirectionWidth.isVertical
       if(mStockList.size != 1) calcRow(rawStocksList, width, vertical)
        calcRow(unDrawnStockList, width, vertical)
    }

    // 座標データの取得
    fun get(): List<Coordinate> {
        return mUnCalcArea.data
    }

    // 計算未完了エリア
    private inner class UnCalcArea(var width: Float, var height: Float) {
        var data: MutableList<Coordinate> = ArrayList()
        var xBeginning: Float = 0.0f
        var yBeginning: Float = 0.0f
    }

    /**
     * @param value 描画未完了エリアの最小辺長
     * @param isVertical 描画する方向
     * */
    private inner class Vertical(var value: Float, var isVertical: Boolean)
}
座標データを基に各セルを描画する
何を描画するのか
- 長方形 (セル)
- 長方形(セル)の色
- 銘柄名、騰落率
- 各長方形間の枠線
※ 銘柄名が全て表示されるように面積比と文字数により大きさを変える処理を入れています。
※ 長方形の着色はArgbEvaluatorを用いているため、2色間の色の変化が動的に行われます。
Rectangle
class Rectangle: View {

    // カスタムview作成用コンストラクタ
    constructor(context: Context, coordinate: Coordinate, parentHeight: Float, parentWidth: Float) : super(context) {
        mCoordinate = coordinate
        mParentWidth = parentHeight
        mParentHeight = parentWidth
    }
    constructor(context: Context, attrs: AttributeSet?) : super(context, attrs)
    constructor(context: Context, attrs: AttributeSet?, defStyleAttr: Int) : super(context, attrs, defStyleAttr)

    // 座標データ
    private var mCoordinate: Coordinate? = null
    // TreeMap描画用コンテナ(親view)の高さ
    private var mParentHeight: Float? = null
    // TreeMap描画用コンテナ(親view)の幅
    private var mParentWidth: Float? = null

    @SuppressLint("RestrictedApi")
    val mArgbEvaluator = ArgbEvaluator()
    @SuppressLint("RestrictedApi")
    private fun evaluate(rate: Float, startValue: Int, endValue: Int): Any = mArgbEvaluator.evaluate(rate, startValue, endValue)

    override fun onDraw(canvas: Canvas?) {
        drawRectangle(canvas)
        super.onDraw(canvas)
    }

    // セルの描画
    private fun drawRectangle(canvas: Canvas?){
        mCoordinate?:return
        mParentHeight?:return
        mParentWidth?:return

        // 座標データの取得
        val coordinate = mCoordinate!!

        // canvasの状態を保存
        val saveCount = canvas!!.save()

        // 銘柄名
        val symbolName = coordinate.data.name
        // 騰落率
        val changeRate =  coordinate.data.changeRate

        // セル幅
        val cellWidth = coordinate.width
        // セル高さ
        val cellHeight = coordinate.height
        // セル面積
        val cellArea = cellHeight.times(cellWidth)
        // 親view面積
        val parentArea = mParentHeight!!.times(mParentWidth!!)
        // 親viewに対する面積比率
        val areaRate = cellArea.div(parentArea).times(100)
        // テキスト 開始位置 x座標
        val textXCo = coordinate.x + cellWidth.div(2)
        // 親viewの高さに対するセルの高さ
        val heightRate = cellHeight.div(mParentHeight!!).times(100)

        // 面積と文字数からテキストサイズを仮決めする
        var cellTextSize = setTextSize(coordinate,areaRate)

        // 銘柄名 最大描画可能高さ
        val symbolNameMaxHeight =  when {
            areaRate > 50 -> {
                cellHeight.div(4).times(3)
            }
            else -> {
                cellHeight.div(2)
            }
        }

        // 騰落率 最大描画可能高さ
        val changeRateHeight =  when {
            heightRate > 90 -> {
                cellHeight.div(3).times(1)
            }
            else -> {
                cellHeight.div(2)
            }
        }

        // 各セル塗り潰し用Paint
        val fillPaint = Paint().apply {
            color = setColorByChangeRate(changeRate.toFloat())
        }

        // 枠線用Paint
        val borderPaint = Paint().apply {
            style = Paint.Style.STROKE
            color = Color.WHITE
            strokeWidth = 3f
        }

        // 銘柄名用Paint
        val symbolNamePaint = TextPaint().apply {
            // センタリング
            textAlign = Paint.Align.CENTER
            textSize = cellTextSize
            typeface = Typeface.create("", Typeface.BOLD)
        }

        // 騰落率用Paint
        val changeRatePaint = TextPaint().apply {
            // センタリング
            textAlign = Paint.Align.CENTER
            textSize = cellTextSize.div(1.2f)
            typeface = Typeface.create("", Typeface.BOLD)
        }

        val rect = Rect(
            coordinate.x.toInt(),
            coordinate.y.toInt(),
            (coordinate.x + cellWidth).toInt(),
            (coordinate.y + cellHeight).toInt()
        )
        canvas.drawRect(rect, fillPaint)
        canvas.drawRect(rect, borderPaint)

        // 仮決めしたテキストサイズで全ての文字を描画できるどうかをここで判定
        val isTextSizeFixNeed = isTextSizeFixNeed(
            symbolName,
            cellWidth,
            symbolNameMaxHeight,
            symbolNamePaint.apply { color = Color.TRANSPARENT })?:return // 透過色で描画

        var isSizeFix: Boolean? = isTextSizeFixNeed

        while (isSizeFix == true) {
            // 1/20サイズダウン
            cellTextSize = cellTextSize.times(19).div(20)
            isSizeFix = isTextSizeFixNeed(
                symbolName,
                cellWidth,
                symbolNameMaxHeight,
                symbolNamePaint.apply {
                    color = Color.TRANSPARENT
                    textSize = cellTextSize
                })
        }

        // 騰落率の高さ・幅を計算
        val symbolNameMeasureAlpha = drawMultilineText(
            canvas = canvas,
            text = symbolName,
            x = textXCo,
            y = 0f,
            width = cellWidth,
            height = symbolNameMaxHeight,
            paint =  symbolNamePaint.apply { color = Color.TRANSPARENT } // 透過色で描画
        ) ?: return

        //  騰落率の高さ・幅を計算
        val changeRateMeasureAlpha = drawMultilineText(
            canvas = canvas,
            text = changeRate.toString(),
            x = textXCo,
            y = 0f,
            width = cellWidth,
            height = changeRateHeight,
            paint =  changeRatePaint.apply { color = Color.TRANSPARENT } // 透過色で描画
        )?: return

        // 描画された銘柄名の高さと幅を取得
        val actualHeight = symbolNameMeasureAlpha.height
        val actualWidth = symbolNameMeasureAlpha.width

        // セルの高さに対する銘柄名の高さを取得
        val actualHeightRate = actualHeight.div(cellHeight).times(100)

        // 銘柄名と騰落率の間のスペース
        val space = cellHeight.div(15)

        // 銘柄名 騰落率 スペースを合わせた合計高さ
        val totalHeight = symbolNameMeasureAlpha.height + changeRateMeasureAlpha.height + space

        // 銘柄名の高さがセルの高さの45%以上、セルの面積が全体の面積の50%以上を占める場合、全て描画できない場合があるため、銘柄名と騰落率の間のスペースを削除する
        val fixedTotalSpace = if(areaRate > 50 && actualHeightRate > 45){
            0f
        } else {
            space
        }

        // y座標を再計算 (縦に中央揃え)
        val fixedSymbolNameYCo = cellHeight.minus(totalHeight).div(2) + coordinate.y

        // 銘柄名を描画
        val symbolNameMeasureHeight =  drawMultilineText(
            canvas = canvas,
            text = symbolName,
            x = textXCo,
            y = fixedSymbolNameYCo,
            width = cellWidth,
            height = symbolNameMaxHeight,
            paint =  symbolNamePaint.apply { color = Color.WHITE } // 白色で描画
        )?: return

        // 騰落率のy座標をセット
        val fixedChangeRateYCo = fixedSymbolNameYCo + symbolNameMeasureHeight.height + fixedTotalSpace

        // 騰落率を描画
        drawMultilineText(
            canvas = canvas,
            text = changeRate.toString(),
            x = textXCo,
            y = fixedChangeRateYCo,
            width = cellWidth,
            height = changeRateHeight,
            paint =  changeRatePaint.apply { color = Color.WHITE } // 白色で描画
        )

        // canvasの状態を復元
        canvas.restoreToCount(saveCount)
    }

    // 面積と文字数からテキストサイズを仮決めする
    private fun setTextSize(coordinate: Coordinate, areaRate: Float): Float{
        // 係数
        val heightCoefficient = 1
        val widthCoefficient = 1.6

        val totalValue = coordinate.width.times(widthCoefficient) + coordinate.height.times(heightCoefficient)

        // 文字数によって文字の大きさを調整
        val textLength = coordinate.data.name.length
        val dividedNumber = when {
            textLength > 8 -> {
                12
            }
            textLength in 6..8 -> {
                10
            }
            textLength in 3..5 -> {
                when{
                    areaRate > 90 -> {
                        9
                    }
                    areaRate <= 90 && areaRate > 70 -> {
                        10
                    }
                    areaRate <= 70 && areaRate > 50 -> {
                        11
                    }
                    areaRate <= 50 && areaRate > 20 -> {
                        12
                    }
                    else -> {
                        13
                    }
                }
            }
            else -> {
                when{
                    areaRate > 90 -> {
                        6
                    }
                    areaRate <= 90 && areaRate > 70 -> {
                        7
                    }
                    areaRate <= 70 && areaRate > 50 -> {
                        8
                    }
                    areaRate <= 50 && areaRate > 20 -> {
                        10
                    }
                    else -> {
                        11
                    }
                }
            }
        }

        return totalValue.div(dividedNumber).toFloat()
    }

    // 暴騰率によってセルのカラーを変更
    private fun setColorByChangeRate(changeRate: Float): Int{
        return when{
            changeRate <= -3 -> {
                Color.rgb(48,204,94)
            }

            changeRate <= -1 &&  changeRate > -3  -> {
                var value = changeRate + 1
                if(value < 0) {
                    value = value.times(-1)
                }

                val rate = value.div(2)

                return evaluate(
                    rate,
                    Color.rgb(41,158,79),
                    Color.rgb(48,204,94)
                ) as Int
            }

            changeRate < 0 &&  changeRate > -1  -> {
                val value = changeRate.times(-1)

                return evaluate(
                    value,
                    Color.rgb(65,69,85),
                    Color.rgb(41,158,79)
                ) as Int
            }

            changeRate == 0f -> {
                Color.rgb(65,69,85)
            }

            changeRate <= 1 &&  changeRate > 0  -> {
                return evaluate(
                    changeRate,
                    Color.rgb(139,68,78),
                    Color.rgb(65,69,85)
                ) as Int
            }

            changeRate <= 3 &&  changeRate > 1  -> {
                val value = changeRate - 1

                val rate = value.div(2)
                return evaluate(
                    rate,
                    Color.rgb(191,64,69),
                    Color.rgb(139,68,78)
                ) as Int
            }
            // 3以上
            else -> {
                Color.rgb(191,64,69)
            }
        }
    }

    /**
     * 複数行のテキストを描画する
     * @param canvas canvas
     * @param text 描画する文字列
     * @param x x座標left
     * @param y y座標top
     * @param width 描画できる最大幅
     * @param height 描画できる最大高さ
     * @param paint Paint
     */
    private fun drawMultilineText(
        canvas: Canvas, text: String, x: Float, y: Float,
        width: Float, height: Float, paint: Paint
    ):MeasureText?{

        // 文字が描画された行数を管理する
        var drawLineCount = 0
        val lineHeightWidth = calcLineHeight(paint)
        val len = text.length
        var sumHeight = lineHeightWidth
        var longestWidth = lineHeightWidth
        var index = 0

        while (index < len && sumHeight <= height) {
            // 1行で描画できる文字数
            val count = paint.breakText(text, index, len, true, width, null)

            if (count == 0) return null

            if(isDrawDots(count,index,len,sumHeight,lineHeightWidth,height)){
                val fixedText = text.substring(index,index + count -1) + ".."
                canvas.drawText(fixedText, 0, fixedText.length , x, y + sumHeight, paint)
            } else {
                canvas.drawText(text, index, index + count, x, y + sumHeight, paint)
            }

            drawLineCount += 1

            index += count
            sumHeight += lineHeightWidth
            longestWidth = if(longestWidth < count.times(lineHeightWidth)) count.times(lineHeightWidth) else longestWidth
        }

        return MeasureText(height = lineHeightWidth.times(drawLineCount),width = longestWidth)
    }

    // 文字を..に変換するかどうかの判定
    private fun isDrawDots(count: Int,index: Int,len: Int,sumHeight: Float,lineHeight: Float,height: Float): Boolean{
        return sumHeight + lineHeight > height && count + index < len
    }

    private fun calcLineHeight(paint: Paint): Float {
        return paint.textSize
    }

    // セル内に全て文字を描画できるどうかの判定
    private fun isTextSizeFixNeed(text: String,width: Float,height: Float,paint: Paint): Boolean?{
        var drawLineCount = 0
        val lineHeightWidth = calcLineHeight(paint)
        val len = text.length
        var sumHeight = lineHeightWidth
        var longestWidth = lineHeightWidth
        var index = 0

        while (index < len && sumHeight <= height){
            // 1行で描画できる文字数
            val count = paint.breakText(text, index, len, true, width, null)

            if (count == 0) return null

            if(isDrawDots(count,index,len,sumHeight,lineHeightWidth,height)) return true

            drawLineCount += 1

            index += count
            sumHeight += lineHeightWidth
            longestWidth = if(longestWidth < count.times(lineHeightWidth)) count.times(lineHeightWidth) else longestWidth
        }

        return false
    }

    // 描画されたテキストの高さと幅を保持するクラス
    inner class MeasureText(val height: Float,val width: Float)
}
ここまでで作成したクラスまとめ
- 株価データクラス StockData
- 座標データクラス Coordinate
- 座標計算クラス CalcCoordinate
- 座標データを基に各セルを描画するクラス Rectangle
最後にMainActivityにて上記クラスを用いて、ツリーマップを描画します。
MainActivity
class MainActivity : AppCompatActivity() {
    override fun onCreate(savedInstanceState: Bundle?) {
        super.onCreate(savedInstanceState)
        setContentView(R.layout.activity_main)
        // 銘柄データを作成
        val stockList: ArrayList<StockData> = makeStockList()

        // TreeMap描画用コンテナView 親View
        val treeMapLayout = findViewById<FrameLayout>(R.id.treeMapLayout)

        treeMapLayout.viewTreeObserver.addOnGlobalLayoutListener(object :
            ViewTreeObserver.OnGlobalLayoutListener {
            override fun onGlobalLayout() {
                // 高さと横幅の取得
                val width = treeMapLayout.width.toFloat()
                val height = treeMapLayout.height.toFloat()

                // 各銘柄の座標データが格納されたリストの取得
                val coordinateList = CalcCoordinate(stockList, width, height).get()

                val rectangleList = mutableListOf<Rectangle>()
                for (data in coordinateList.withIndex()) {

                    val coordinate = data.value

                    val rectangle = Rectangle(
                        this@MainActivity,
                        coordinate,
                        treeMapLayout.width.toFloat(),
                        treeMapLayout.height.toFloat()
                    )
                    rectangleList.add(rectangle)
                    treeMapLayout.addView(rectangle)
                }
                treeMapLayout.viewTreeObserver.removeOnGlobalLayoutListener(this)
            }
        })
    }

    private fun makeStockList(): ArrayList<StockData>{
        val list = arrayListOf<StockData>()
        list.add(StockData(amount = 22.0,name = "AAPL",changeRate = 0.2))
        list.add(StockData(amount = 18.0,name = "TSLA",changeRate = 0.8))
        list.add(StockData(amount = 15.0,name = "GOOGLE",changeRate = -3.8))
        list.add(StockData(amount = 10.0,name = "AMZN",changeRate = 0.8))
        list.add(StockData(amount = 8.0,name = "FB",changeRate = 1.2))
        list.add(StockData(amount = 7.0,name = "MSFT",changeRate = 3.2))
        list.add(StockData(amount = 7.0,name = "PG",changeRate = -1.2))
        list.add(StockData(amount = 6.0,name = "WMT",changeRate = -0.8))
        list.add(StockData(amount = 5.0,name = "AVGO",changeRate = 0.0))
        list.add(StockData(amount = 2.0,name = "IBM",changeRate = 0.6))
        return list
    }
}
activity_main.xml
<?xml version="1.0" encoding="utf-8"?>
<androidx.constraintlayout.widget.ConstraintLayout
    xmlns:android="http://schemas.android.com/apk/res/android"
    xmlns:app="http://schemas.android.com/apk/res-auto"
    xmlns:tools="http://schemas.android.com/tools"
    android:layout_width="match_parent"
    android:layout_height="match_parent"
    tools:context=".MainActivity">
    <FrameLayout
        android:id="@+id/treeMapLayout"
        android:layout_width="match_parent"
        android:layout_height="match_parent">
    </FrameLayout>
</androidx.constraintlayout.widget.ConstraintLayout>
終わりに
以上で完成です。
ツリーマップの描画方法はネットでなかなか見つからないので、是非この記事を参考にして頂ければ幸いです。
おまけ
タップした銘柄に枠線を表示させたいと思います。
完成形

枠線表示用クラスを追加する
タッチされた座標を基にタップ銘柄を特定し、その銘柄の座標データを用いて枠線を描画します。
Border.kt
class Border: View {
    // カスタムview作成用コンストラクタ
    constructor(context: Context, coordinate: Coordinate) : super(context){
        mCoordinate = coordinate
    }
    constructor(context: Context, attrs: AttributeSet?) : super(context, attrs)
    constructor(context: Context, attrs: AttributeSet?, defStyleAttr: Int) : super(
        context,
        attrs,
        defStyleAttr
    )

    // 座標データ
    private var mCoordinate: Coordinate? = null

    // 枠線用Paint
    private val mPaint = Paint().apply {
        style = Paint.Style.STROKE
        color = Color.YELLOW
        strokeWidth = 4f
    }

    override fun onDraw(canvas: Canvas?) {
        drawFrameBorder(canvas)
        super.onDraw(canvas)
    }

    // 枠線の描画
    private fun drawFrameBorder(canvas: Canvas?) {
        mCoordinate?:return
        // canvasの状態を保存
        val saveCount = canvas!!.save()
        canvas.drawRect(
            mCoordinate!!.x,
            mCoordinate!!.y,
            mCoordinate!!.x + mCoordinate!!.width,
            mCoordinate!!.y + mCoordinate!!.height,
            mPaint
        )
        // canvasの状態を復元
        canvas.restoreToCount(saveCount)
    }
}
MainActivityにてタッチリスナーを追加します。
MainActivity.kt
class MainActivity : AppCompatActivity() {

    private var mBorder: Border? = null  // 追加

    override fun onCreate(savedInstanceState: Bundle?) {
        super.onCreate(savedInstanceState)
        setContentView(R.layout.activity_main)
        // 銘柄データを作成
        val stockList: ArrayList<StockData> = makeStockList()

        // TreeMap描画用コンテナView 親View
        val treeMapLayout = findViewById<FrameLayout>(R.id.treeMapLayout)

        treeMapLayout.viewTreeObserver.addOnGlobalLayoutListener(object :
            ViewTreeObserver.OnGlobalLayoutListener {
            override fun onGlobalLayout() {
                // 高さと横幅の取得
                val width = treeMapLayout.width.toFloat()
                val height = treeMapLayout.height.toFloat()

                // 各銘柄の座標データが格納されたリストの取得
                val coordinateList = CalcCoordinate(stockList, width, height).get()

                val rectangleList = mutableListOf<Rectangle>()
                for (data in coordinateList.withIndex()) {

                    val coordinate = data.value

                    val rectangle = Rectangle(
                        this@MainActivity,
                        coordinate,
                        treeMapLayout.width.toFloat(),
                        treeMapLayout.height.toFloat()
                    )
                    rectangleList.add(rectangle)
                    treeMapLayout.addView(rectangle)
                }
                treeMapLayout.setOnTreeMapLayoutTouchListener(rectangleList)
                treeMapLayout.viewTreeObserver.removeOnGlobalLayoutListener(this)
            }
        })
    }

    private fun makeStockList(): ArrayList<StockData>{
        val list = arrayListOf<StockData>()
        list.add(StockData(amount = 22.0,symbolName = "AAPL",changeRate = 0.2))
        list.add(StockData(amount = 18.0,symbolName = "TSLA",changeRate = 0.8))
        list.add(StockData(amount = 15.0,symbolName = "GOOGLE",changeRate = -3.8))
        list.add(StockData(amount = 10.0,symbolName = "AMZN",changeRate = 0.8))
        list.add(StockData(amount = 8.0,symbolName = "FB",changeRate = 1.2))
        list.add(StockData(amount = 7.0,symbolName = "MSFT",changeRate = 3.2))
        list.add(StockData(amount = 7.0,symbolName = "PG",changeRate = -1.2))
        list.add(StockData(amount = 6.0,symbolName = "WMT",changeRate = -0.8))
        list.add(StockData(amount = 5.0,symbolName = "AVGO",changeRate = 0.0))
        list.add(StockData(amount = 2.0,symbolName = "IBM",changeRate = 0.6))
        return list
    }

    // ↓↓↓ 追加
    @SuppressLint("ClickableViewAccessibility")
    private fun ViewGroup.setOnTreeMapLayoutTouchListener(rectangleList: List<Rectangle>) {
        setOnTouchListener { _: View, motionEvent: MotionEvent ->
            when (motionEvent.action) {
                MotionEvent.ACTION_DOWN -> {
                    val filteredList = rectangleList.filter {
                        it.getCoordinate()?.x!! <= motionEvent.x &&
                                motionEvent.x <= it.getCoordinate()?.x!! + it.getCoordinate()?.width!! &&
                                it.getCoordinate()?.y!! <= motionEvent.y &&
                                motionEvent.y <= it.getCoordinate()?.y!! + it.getCoordinate()?.height!!
                    }
                    if (filteredList.isEmpty()) return@setOnTouchListener false
                    val targetRectangle = filteredList.first()
                    if(mBorder != null) this.removeView(mBorder)
                    mBorder = targetRectangle.getBorder()
                    this.addView(mBorder)
                    return@setOnTouchListener false
                }
                else -> {false}
            }
        }
    }
}
以上で終わりです。^^