やりたいこと
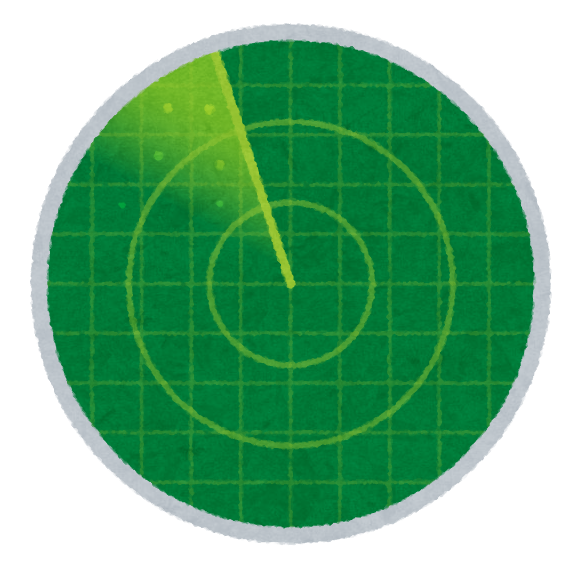
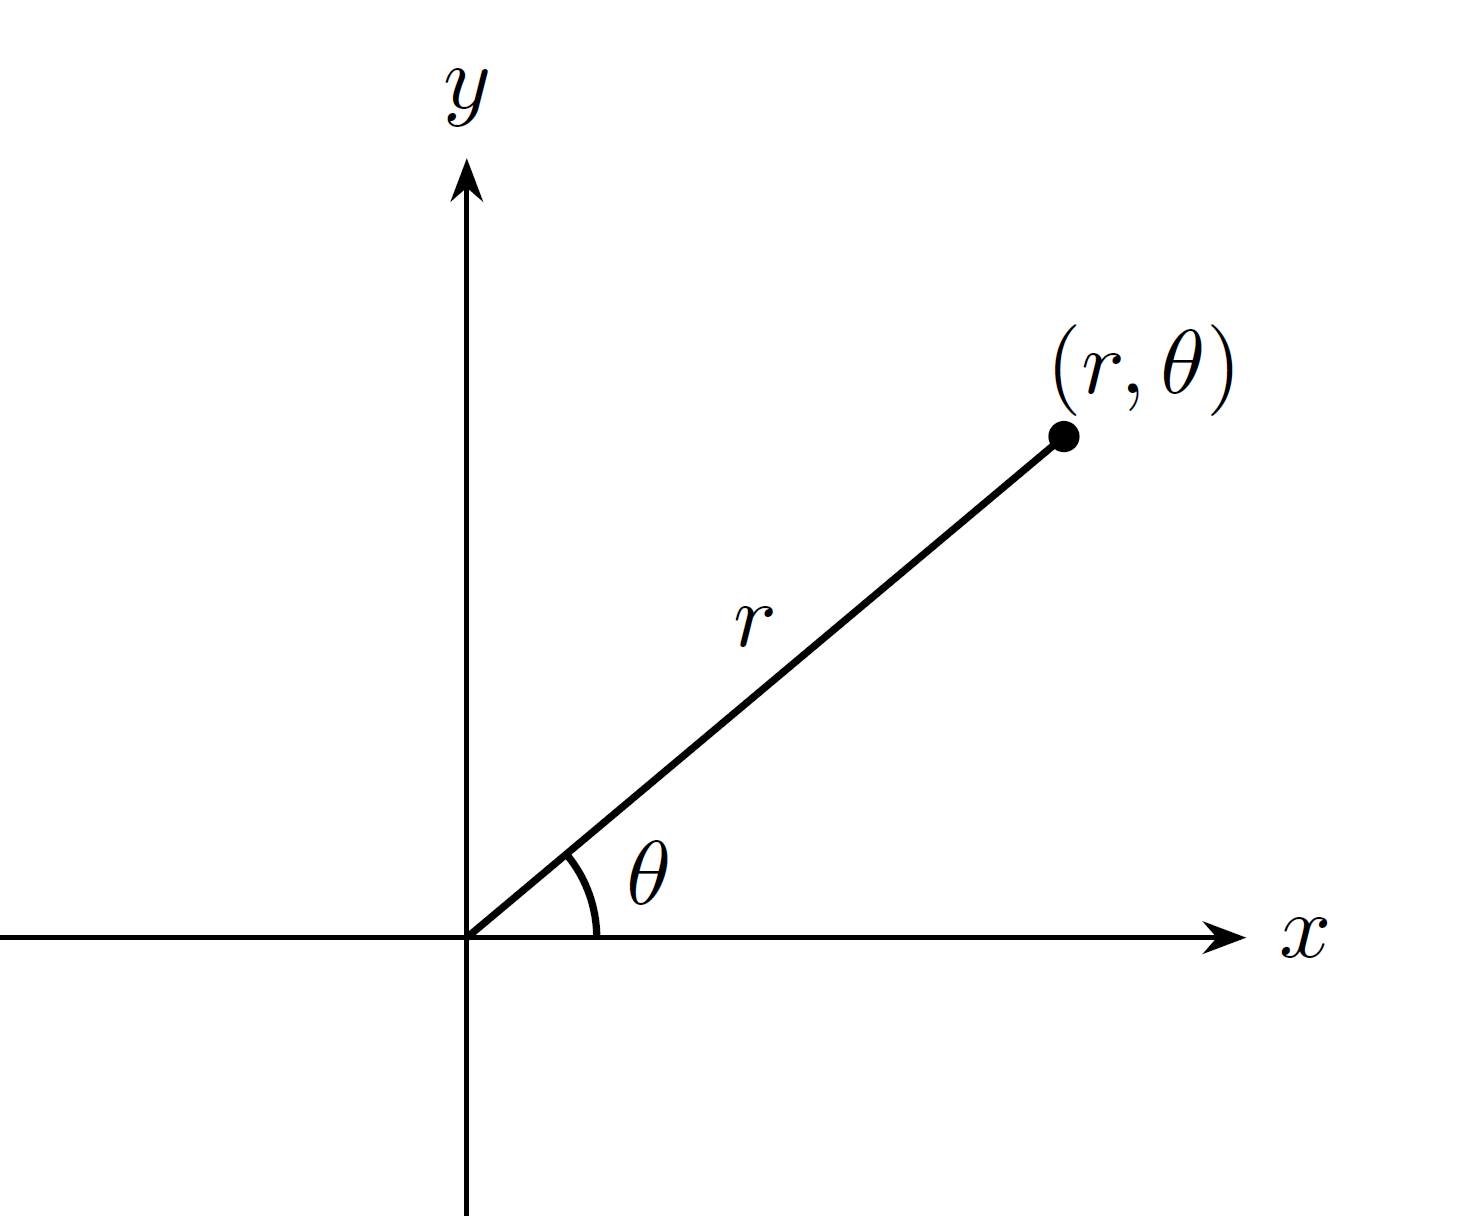
原点からの距離 $r$ と角度 $\theta$ に依存するデータ $P(r,\theta)$ を $xy$ 平面に描画することを考えます.例えば,レーダで取得した信号には,ターゲットとの距離 $r$ と方位角 $\theta$ の情報が含まれます.ちょうど下図のイメージです.

本記事では,$x$ 軸から測った角度を $\theta$ とします.

表示例
$r,\theta$ に依存するダミーデータ $P(r,\theta)$ を作成して,それを $xy$ 平面に描画することを考えます.
ダミーデータ
ターゲットの位置を極座標系で $(r_0,\theta_0)$ として,ダミーデータ $P(r,\theta)$ をガウス分布の積として生成します.
P(r,\theta) = \dfrac{1}{\sqrt{2\pi\sigma_r^2}} \exp{\left[-\dfrac{(r-r_0)^2}{2\sigma_r^2}\right]}\cdot \dfrac{1}{\sqrt{2\pi\sigma_\theta^2}} \exp{\left[-\dfrac{(\theta-\theta_0)^2}{2\sigma_\theta^2}\right]}
$\sigma_r^2$, $\sigma_\theta^2$ は距離および角度方向の分散を表します.
変換および描画
距離と角度を定義し,meshgrid関数で二次元配列に変換します.そして,ターゲットの位置 $(r_0,\theta_0)$ を決めて,ダミーデータ $P(r,\theta)$ を生成します.
% define range and theta
range = linspace(0,2,31); % m
theta = deg2rad(linspace(0,360,91)); % rad
[Range,Theta] = meshgrid(range,theta);

% target position
r0 = 1;
theta0 = deg2rad(75);

% dummy data P
gaussfunc = @(x,mu,sigma) 1/(sqrt(2*pi)*sigma)*exp(-(x-mu).^2/(2*sigma^2));
P = gaussfunc(Range,r0,0.2).*gaussfunc(Theta,theta0,0.2);
次に,極座標系から直交座標系へ変換します.極座標 $(r,\theta)$ は直交座標 $(x,y)$ と以下のように対応します.
\left\{
\begin{align}
x &= r\cos{\theta} \\
y &= r\sin{\theta}
\end{align}
\right.
距離と角度の二次元配列を用いて,要素ごとに積をとることで $x,y$ に変換します.また,オマケとして,ダミーデータ $P(r,\theta)$ の最大点のインデックスも抽出しておきます.
% convert from circular coordinates to Cartesian coordinates
X = Range.*cos(Theta);
Y = Range.*sin(Theta);

% detect max value and its index
[maxval,maxidx] = max(P,[],'all');
[maxidx_row,maxidx_col] = ind2sub(size(P),maxidx);
MATLABでは,要素ごとの積を .* でとります.
描画には surface プロット を用います.
surface(X,Y,Z,C)
X,Y,Z はメッシュ状の $x,y,z$ 座標,C は色を決める配列です.
X,Y,Z,C はすべて同じ大きさである必要があります.
surfaceプロットは,本来,3次元空間上に曲面を描画する関数です.しかし,今回欲しいのは $xy$ 平面上の2次元画像なので,$z$ 座標の値はすべて 0 にしてしまっても問題ありません.このとき,図を真上から見下ろすことで2次元画像になります.
FS = 16; % fontsize
MS = 30; % markersize

figure(1);
clf(1);
surface(X,Y,zeros(size(X)),P,'EdgeColor','none'); % surface plot
hold on;
plot3(X(maxidx),Y(maxidx),0,'.r','MarkerSize',MS); % plot max point
xlabel('x (m)');
ylabel('y (m)');
cb = colorbar;
cb.Label.String = 'Data value';
daspect([1,1,1]); % Set the axes data aspect ratio
set(gca,'fontsize',FS);
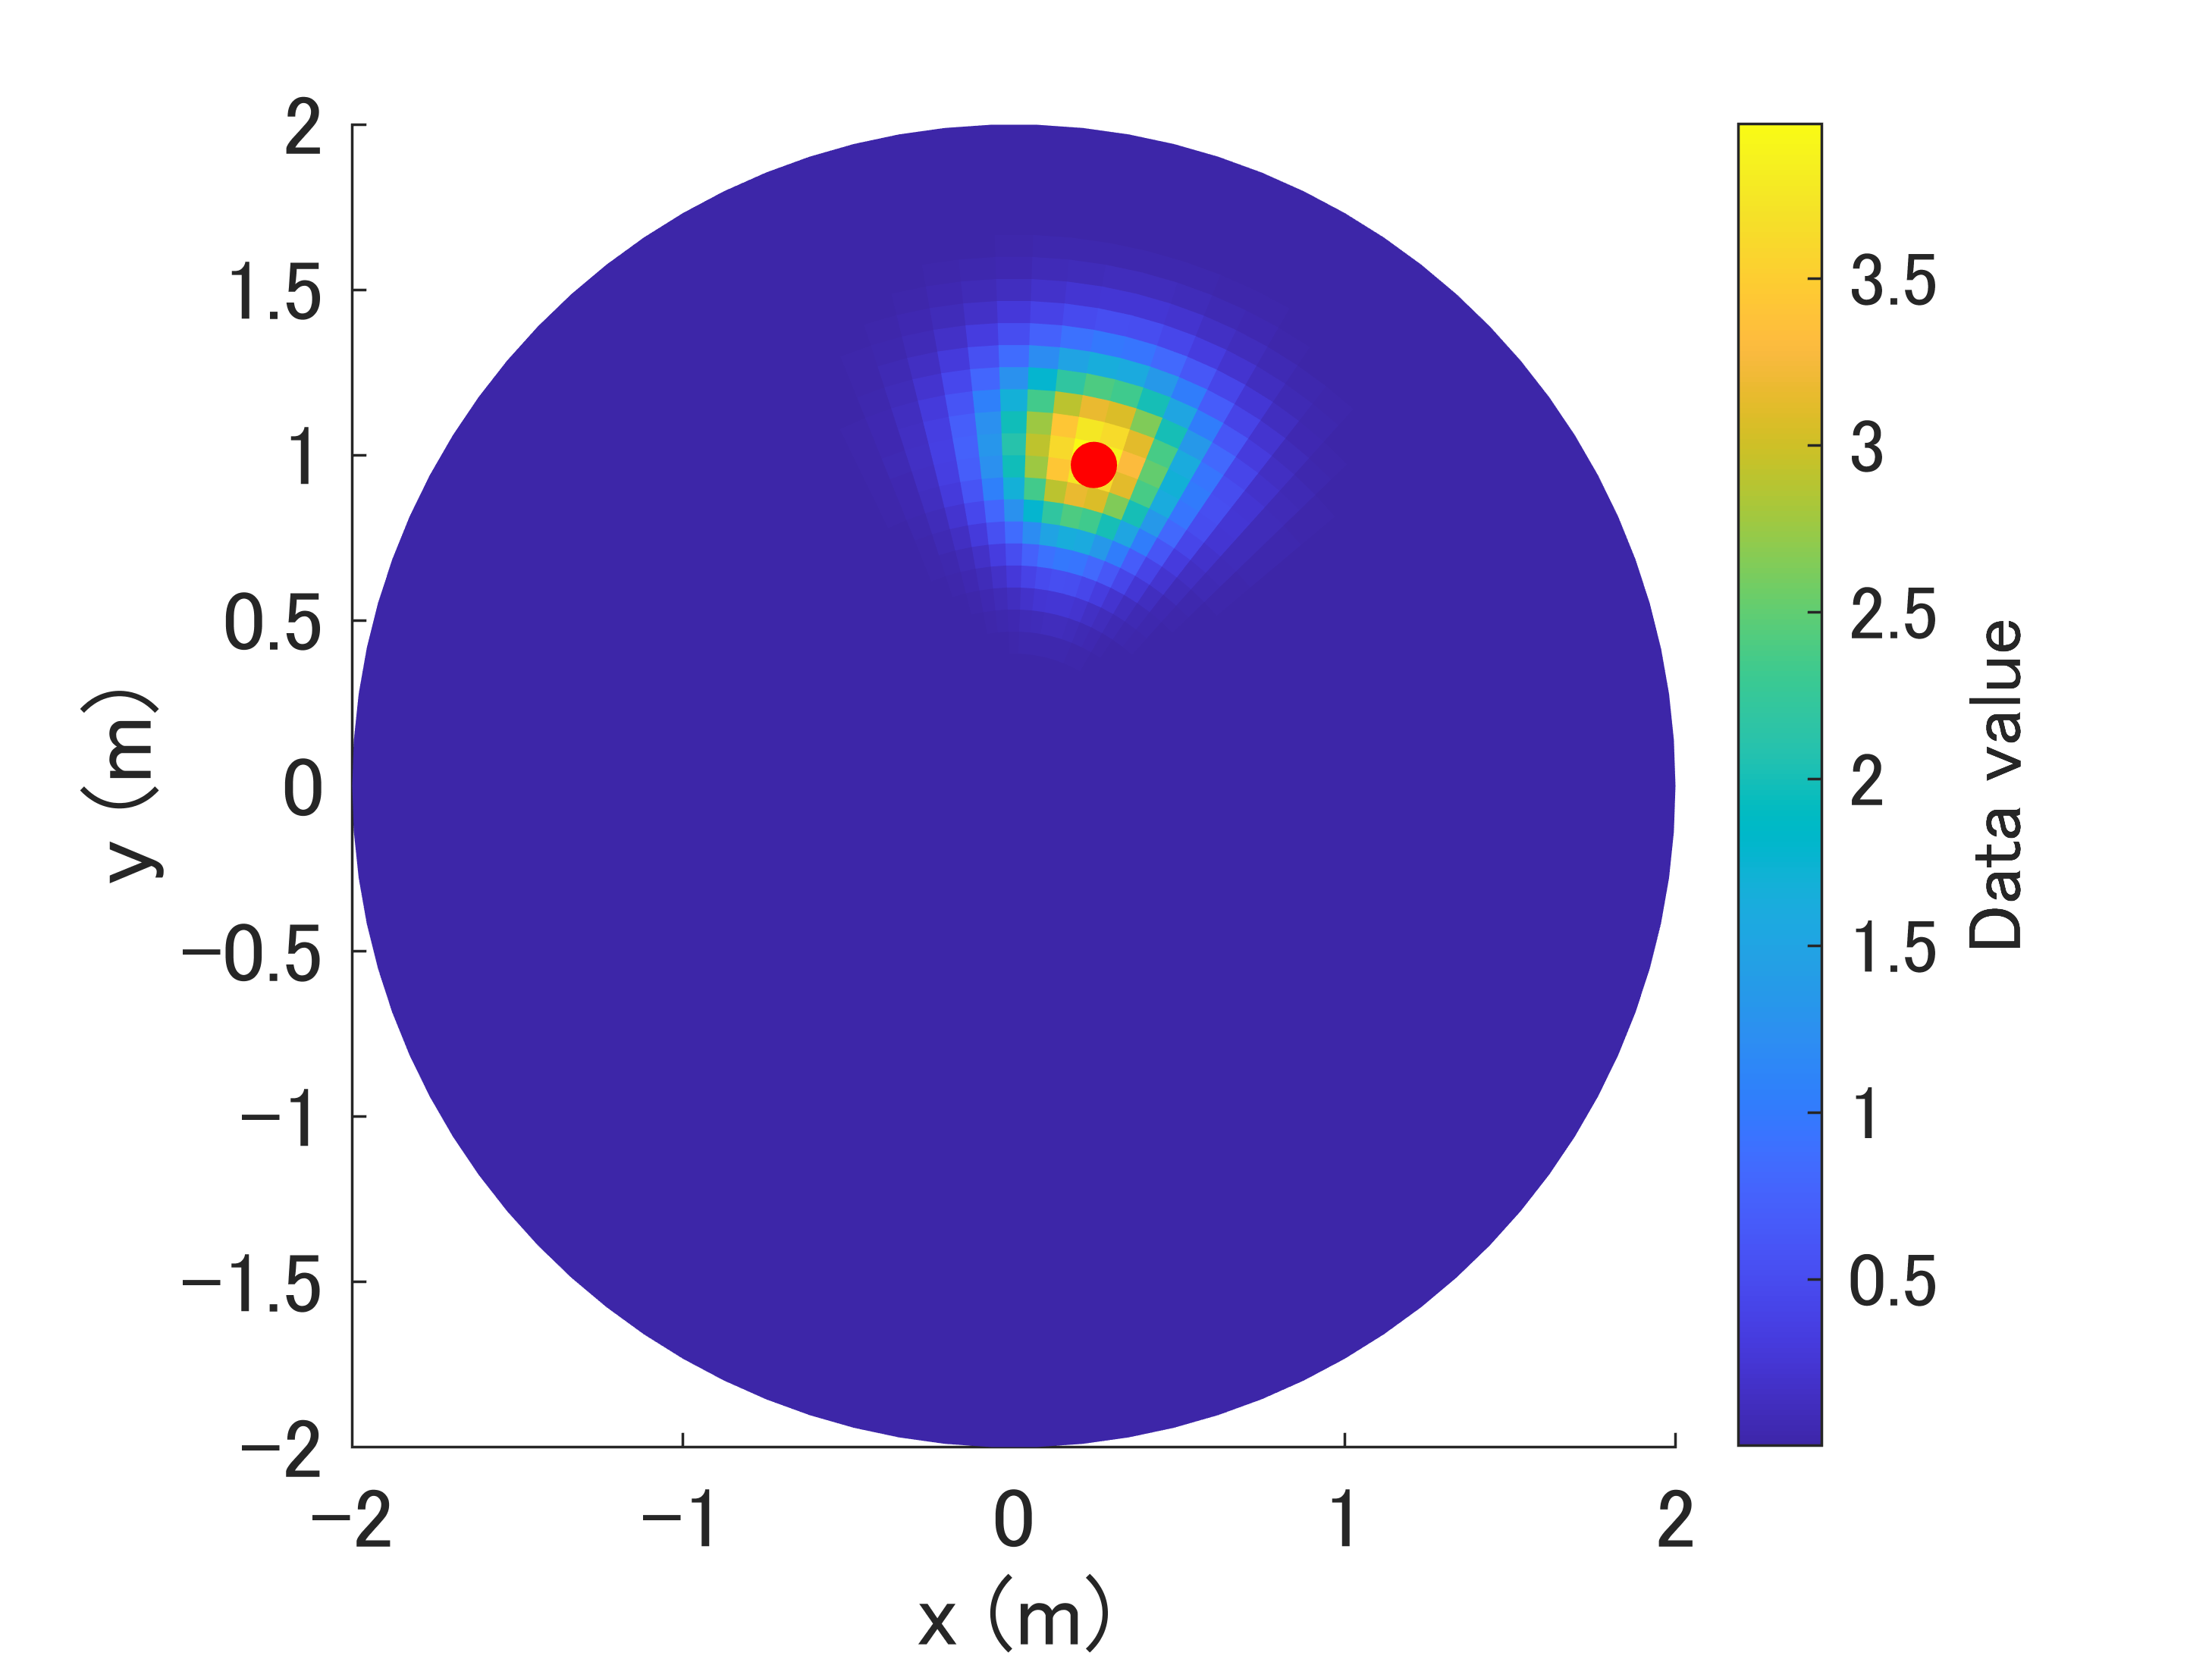
下図は,$r_0 = 1\hspace{1mm}\mathrm{m}, \theta_0 = 75^\circ$ としたときに得られる画像です.赤点は最大点の位置を示します.

最大点の位置が少しずれているように見えるのは,surface関数の仕様上の理由です.surface関数は各データを面単位ではなく,頂点の単位で描画しているため,若干のずれが発生します.メッシュが細かくなると,ずれは小さくなります.
実行環境
MATLAB R2022a
使用したツールボックス:なし