成果物
ソースコードはMATLAB Exchangeにも置きました.
https://jp.mathworks.com/matlabcentral/fileexchange/82280-calctextposinscatterplot
散布図にラベルを付けたい
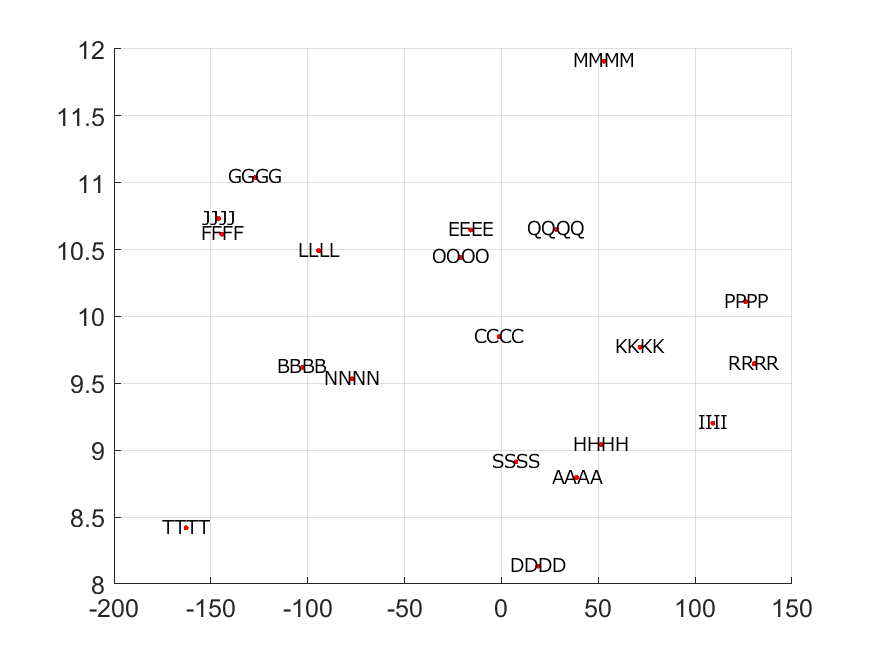
散布図の各データ点にラベルを記入したい場合,データが密集しているとラベルが重なって読めなくなってしまいます.たとえばこんな感じ.
そのような場合,ラベルの位置をデータと他のラベルに応じて自動で調整したくなります.手動は現実的ではありません.ラベルとデータを線でつなぐとよりよさそうです.
ということでやってみました.
ソースコード
function [txPos]=calcTextPosInScatterPlot(dtPos)

x=dtPos(:,1);y=dtPos(:,2);
dtPos=[x,y];

figure
scatter(x,y);
tmpAx=axis;tmpScl=tmpAx*[[-1;1;0;0] [0;0;-1;1]];
txPos=1.00*[x y];
txPosOld=txPos;
close(gcf)

for n1=1:1000
    for n2=1:size(txPos,1)
        for n3=1:size(dtPos,1)
            dv=(dtPos(n3,:)-txPos(n2,:))./tmpScl;
            if norm(dv)>0.01
                txPos(n2,:)=txPos(n2,:)-3e-6*dv.*tmpScl/norm(dv)^2;
            end
        end
        for n3=1:size(txPos,1)
            if n2~=n3
                dv=(txPos(n3,:)-txPos(n2,:))./tmpScl;
                txPos(n2,:)=txPos(n2,:)-2e-6*dv.*tmpScl/norm(dv)^2;
            end
        end
    end
    if    norm((txPosOld-txPos)./tmpScl)<1e-4
        break;
    end
    txPosOld=txPos;

end
end
ソースコード解説
入力 dtPos は散布図で表示したいデータ,出力 txPos はラベルの位置です.
基本の発想は以下です.
-
dtPosおよびtxPosそれぞれの点の間に斥力が働いているものと仮定する. - 斥力に応じて
txPosを修正する.
4. 距離が近いほど斥力は大きいとする(ただし,近いデータがあると遠くに飛んでしまうのでそのあたりは各自調整してください) - 修正量が小さくなったら止める.
微調整が必要なパラメータがいくつかあって,データの分布に対してどの程度の値が適切なのかが変わりそうなので,利用時は適宜調整してください.一応各軸の画面上のスケールには対応できています(距離はデータの値そのものではなく,画面の見た目に近くなるように各軸を正規化しています).
スケールに対応するために,一度散布図を描画したのちにaxisで各軸の範囲を取得しています.
実装例
利用時にはデータとラベルの位置を破線で結ぶとわかりやすいでしょう.実装例です.
clear
clc
close all

plotData=[100*randn(20,1) randn(20,1)+10];
plotText=char(('A'+(0:19)')*[1 1 1 1]);
textPosition=calcTextPosInScatterPlot(plotData);

figure
hold on;

for n1=1:size(plotData,1)
    plot([textPosition(n1,1) plotData(n1,1)], ...
        [textPosition(n1,2) plotData(n1,2)],'b--')
    text(textPosition(n1,1), textPosition(n1,2), ...
        plotText(n1,:), 'HorizontalAlignment','center','fontname','メイリオ', ...
        'BackgroundColor','w');
end
scatter(plotData(:,1),plotData(:,2));

grid on;
set(gca,'FontName','arial','FontSize',12)
saveas(gca,'usage_02','png')
出力の見栄えを考えると,
- データとラベルをつなぐ線
- ラベル
- データ
の順に描画した方がよいので,そのように実装しています.
雑感と個人的なつぶやき
グラフの描画だと,位置を適当に配置してくれる機能があって(graphに対するplot関数),それも多分ここで示したように仮想的な斥力を計算してノードを配置していると想像しています.ので,散布図の場合でも公式で対応してもらえるとむっちゃうれしいなぁ…


