COVID-19累計感染確定者数を区分線系システムとして同定する
UPDATE: 30-MAR-2020
誤解を与えそうな表現と,既存の概念と混同しやすい部分について追記しました.
UPDATE: 25-Mar-2020
最終成果物
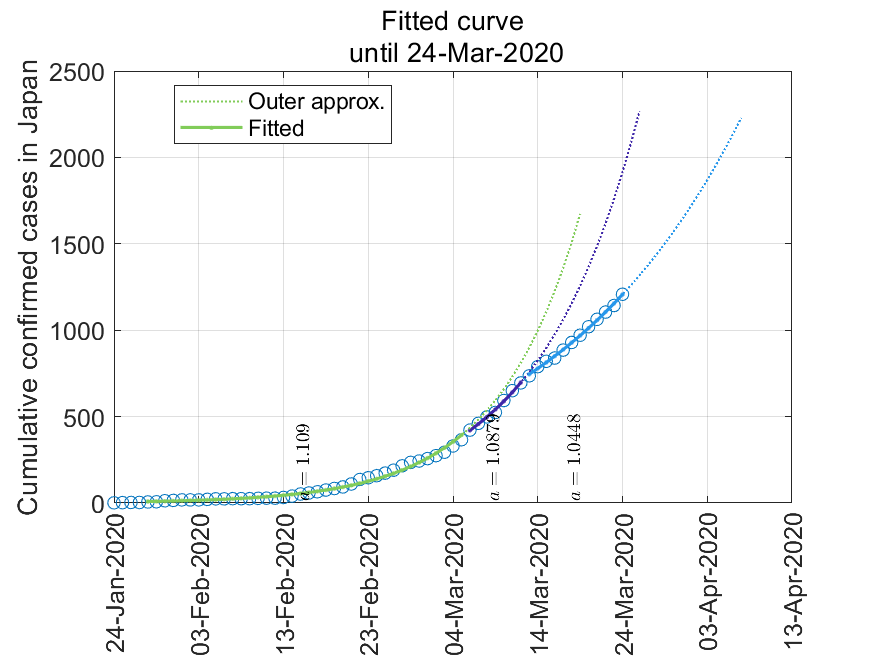
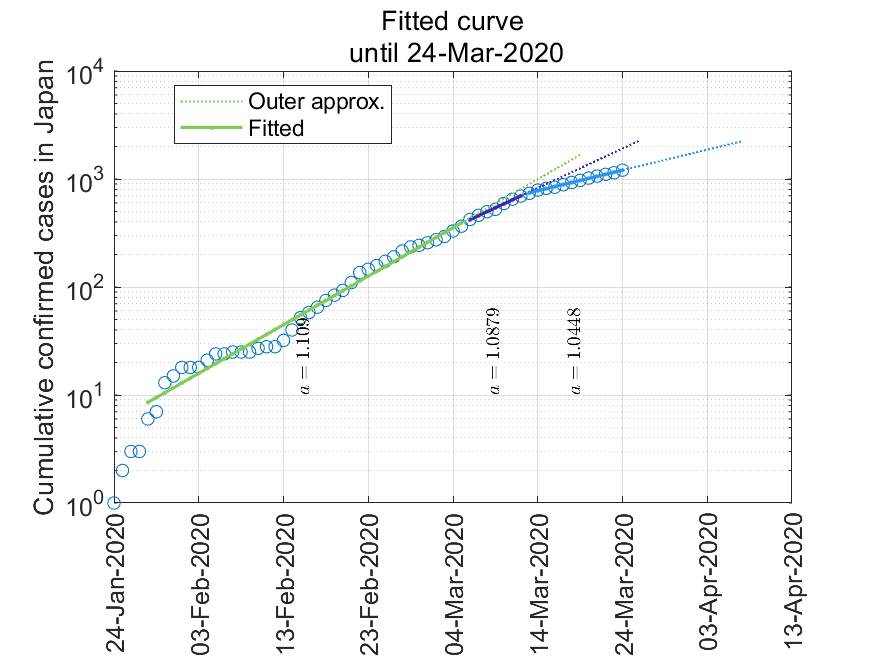
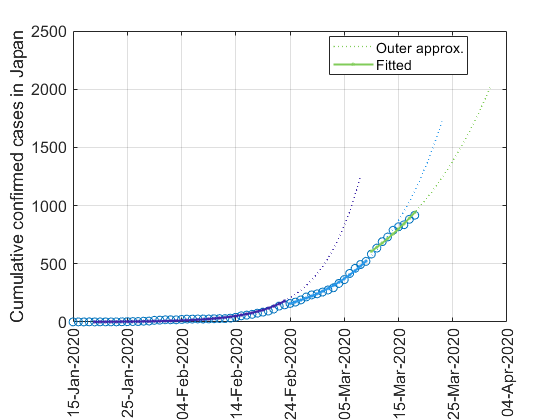
実線が実累計数を指数関数近似したもの,点線はそれを14日後まで外挿したものです.執筆日(2020年3月19日)時点では累計者数はいまだに指数関数的に増加していますが,その勢いが少しづつ弱まっているのではないか,と読み取れます.
注:著者は公衆衛生などについて専門教育を受けておらず,この記事の内容は未来の予測を与えるものではないことを明記します.
はじめに
今日(2020年3月19日)時点で世界中で感染者を増やしているCOVID-19の国内累計感染者数については,様々なサイトで情報公開が行われています.
その中でも下記サイトは感染者のデータをcsvファイルで公開しています.さらに,「累計感染確定者数の対数表示」を実装しており,感染モデル(下記)のふるまいの理解の観点からも有用なものです.
都道府県別新型コロナウイルス感染者数マップ(ジャッグジャパン株式会社提供)
この記事は以下の順で構成されています.
- 感染症拡大の基礎的なモデルやシミュレーションを紹介し,拡大初期には指数関数的に感染者(新規および累計)が増加することを確認します.
- 累計感染者数の増加の傾向を確認するため,累積確定者数を区分線系システムとして同定します.
- 結論:執筆日(2020年3月19日)時点では累計者数が指数関数的に増加していますが,その勢いが少しづつ弱まっているのではないだろうか?
感染症拡大の基礎的な数理モデルの紹介
感染症にかかってしまった患者の体内ではウイルスが増殖し,咳などとともに拡散して健康な人がウイルスに感染してしまうことがあります.1人の患者からウイルスが出てこなくなるまでに,あらたに1人より多い患者を増やしてしまうと,患者は減らないことになります.この様子をわかりやすくシミュレーションした記事があります.未読の方はぜひ.
コロナウイルスなどのアウトブレイクは、なぜ急速に拡大し、どのように「曲線を平らにする」ことができるのか
非常に単純化して,1人の患者が2名の患者を増やした後で回復すると仮定すると, 単位時間当たりに増加する感染者数が2倍になると仮定すると以下の図が得られます.(2020/3/30修正)
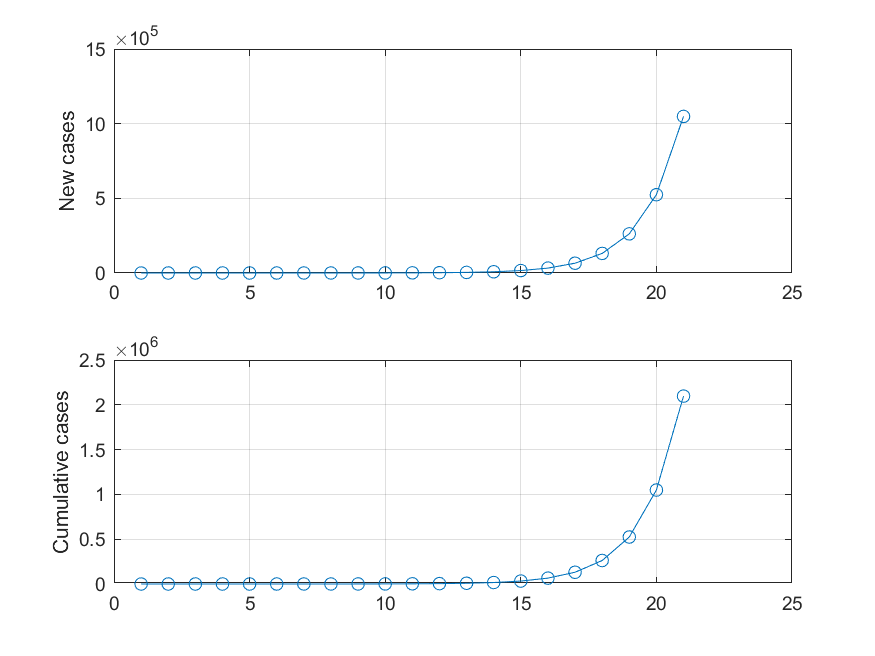
横軸は単位時間,縦軸は新規患者数および累積患者数です.非常に急速に患者数が増加し,これは「指数関数的増加」です.増加が指数関数的かどうかを判定するためには,縦軸の取り方を「対数軸」に変えるのが一般的です.
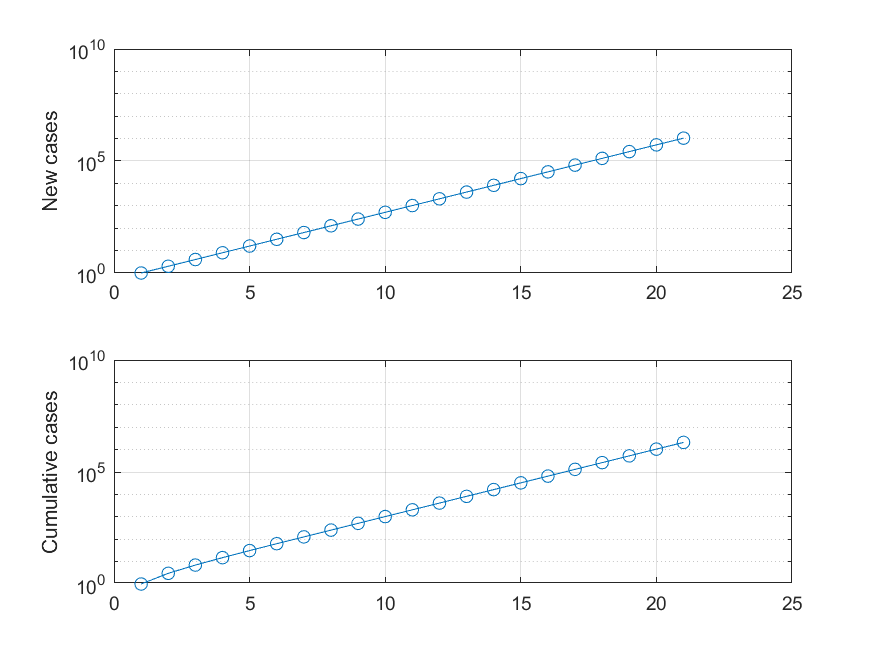
指数関数は縦軸を対数軸としたときに直線となる性質があり,よく利用されます.
COVID-19累計感染確定者数データを見る
COVID-19は感染拡大の初期にあり,指数関数的に累積感染者数を増やしている最中である,と仮定します.累積感染者数のデータを以下のサイトからcsv形式でダウンロードします.
都道府県別新型コロナウイルス感染者数マップ(ジャッグジャパン株式会社提供)
私がよく使っているMATLABでは,文字数値交じりのデータはExcel形式が使いやすいので,手動で変換し,COVID-19.xlsxとして保存します.
データの前処理をして,累計を縦対数グラフで描画します.
%% Data preparation
% clear workspace and load data
clear
clc
close all

[num,txt,raw]=xlsread('COVID-19.xlsx');

%%
% Extract date and calculate cumulative confirmed cases
firstDate=raw{2,8}
finalDate=raw{end,8}

t_raw=zeros(size(raw,1)-1,1);

for n1=2:size(t_raw,1)
    tmpDate=raw{n1,8};
    t_raw(n1-1,1)=datenum(tmpDate);
end

t_raw(end)=[];
t_raw=t_raw-min(t_raw);
t=(min(t_raw):max(t_raw))';
y=hist(t_raw,t)';
yCum=filter(1,[1,-1],y);

%%
figure
plot(yCum,'o')
grid on;
set(gca,'FontName','Arial','FontSize',12)
xLabelStrs=datestr( datenum(firstDate)+xticks);
set(gca,'XTickLabel',xLabelStrs, ...
    'XTickLabelRotation',90);
ylabel('Cumulative confirmed cases in Japan')
title({['Cumulative confirmed cases of COVID-19 in Japan'],[' until' datestr(finalDate)]})
saveas(gca,'COVID19ActualCumulative_linear','png')

set(gca,'YScale','log')
saveas(gca,'COVID19ActualCumulative_semilogy','png')
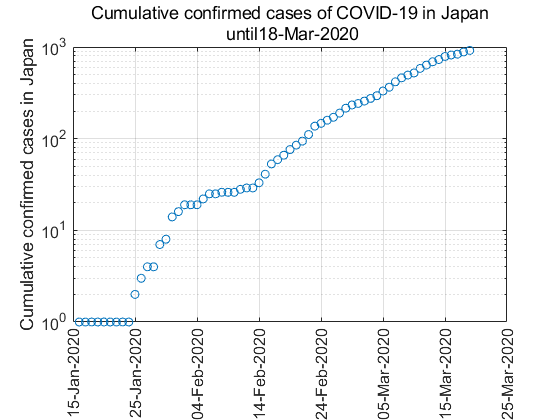
1本の直線ではなく,いくつかの折れ線で構成されているように見えます.
区分線系システムとして同定する
このデータを区分線系システム(piecewise-affine system)として同定します.簡単に言うと折れ線での近似です.同定には以下の手法の簡略版を使用しました.
日付$k$での累計感染確定者数を$y[k]$とし,時刻とともにパラメータが変化する区分線系システム
$y[k]=a_i y[k-1], {\mathrm {if}}~~ k\in K_i,~~ i=1,\cdots, N_{modes}$
に従うと仮定します.上記論文のアルゴリズムは$a_i$と$K_i$をクラスタリングを用いて同時に求めるものです.
それでは処理を始めましょう.短期的・局所的な同定から始めます.
%% Model identification as piecewise-linear system
% The method used here is a simplified version of the following paper:
% Giancarlo Ferrari-Trecate, Marco Muselli, Diego Liberati, Manfred Morari,
% "A clustering technique for the identification of piecewise affine
% systems," Automatica, Volume 39, Issue 2, 2003, Pages 205-217,


c=4; % number of data used to local identification
x=[];
for n1=c+1:size(t,1)
    tmpY0=yCum(n1-c+1:n1);
    tmpY1=yCum(n1-c:n1-1);
    m=mean(tmpY0);
    xi=tmpY1\tmpY0;

    x=[x; [xi;m]'];
end

Z=linkage(x,'ward');

%%
% plot dendrogram
figure
dendrogram(Z,'Orientation','left')
set(gca,'FontName','Arial','FontSize',10)
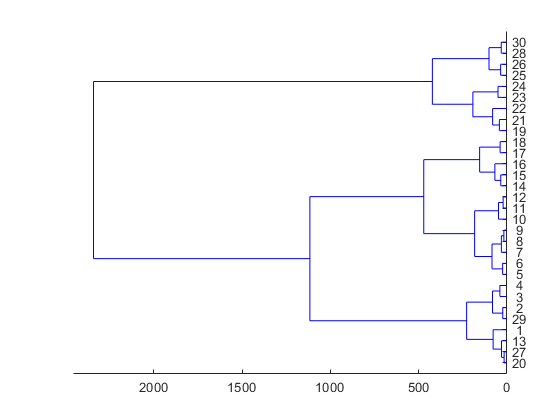
この図からは3つのモード$(N_{modes}=3)$に分割したほうがよさそうなことがわかります.クラスタリングした特徴ベクトル(たった2次元!)を図示してみます.
% From the dendrogram, the set of feature vectors should be partitioned into
% numOfModes=3 modes.
% Plot the feature vectors in each cluster.
numOfModes=3; % number of modes
T=cluster(Z,'maxclust',numOfModes);
T=[nan(c,1);T];
x=[nan(c,2);x];
cmap=colormap(parula(numOfModes+1));
figure
hold on
for n1=1:numOfModes
    ind=find(T==n1);
    scatter(x(ind,1),x(ind,2),'CData',cmap(n1,:))
end
set(gca,'FontName','Arial','FontSize',12)
xlabel('a')
ylabel('m')
grid on;
title({['Feature vectors'],[' until' datestr(finalDate)]})
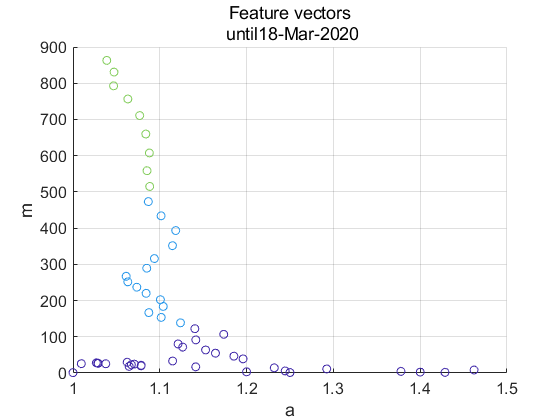
横軸は短期的なパラメータ$a$,縦軸は短期的な$y$の平均値$m$です.$m$の増加とともに$a$が減って1に近づいている傾向にあります.
このクラスタリング結果に基づいて元データから各モードを再同定します.
% For each mode, corresponding linear model is re-identified.
figure;
plot(t,yCum,'o');
hold on;
grid on;

for n1=1:numOfModes
    ind=find(T==n1);
    tmp=log(yCum(ind));
    A=[t(ind) ones(size(t(ind)))];
    xi=A\tmp;
    disp(['From: ' datestr( [min(t(ind))]+datenum( firstDate))])
    disp(['To: ' datestr( [max(t(ind))]+datenum( firstDate))])
    a=exp(xi(1))
    plotT=[t(ind);(max(t(ind))+1:max(t(ind))+14)'];
    h1=plot(plotT,exp([plotT ones(size(plotT))]*xi),':','LineWidth',1.0,'Color',cmap(n1,:));

    plotT=[t(ind)];
    h2=plot(plotT,exp([plotT ones(size(plotT))]*xi),'.-','LineWidth',1.5,'Color',cmap(n1,:));
end
legend([h1,h2],{'Outer approx.','Fitted'},'Location','best')
set(gca,'FontName','Arial','FontSize',12)
xLabelStrs=datestr( datenum(firstDate)+xticks);
set(gca,'XTickLabel',xLabelStrs, ...
    'XTickLabelRotation',90);
ylabel('Cumulative confirmed cases in Japan')
saveas(gca,'COVID19Identification_linear','png')
set(gca,'yscale','log')
saveas(gca,'COVID19Identification_semilogy','png')
(出力)
From: 19-Jan-2020
To: 23-Feb-2020

a =

    1.1487

From: 24-Feb-2020
To: 09-Mar-2020

a =

    1.0889

From: 10-Mar-2020
To: 18-Mar-2020

a =

    1.0563
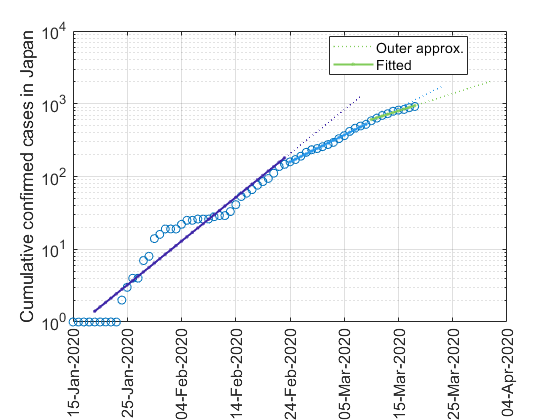
$a=1.1487\to 1.0889\to 1.0563$と徐々に小さくなっています.$y$は累計で減少することはないので,$a=1$となると新規感染確定者がいなくなったことを示します.ただし,ここでの$a$の値は基本再生産数$R_0$ではないことに注意してください(関連のある値ではありますが).(20200330追記)
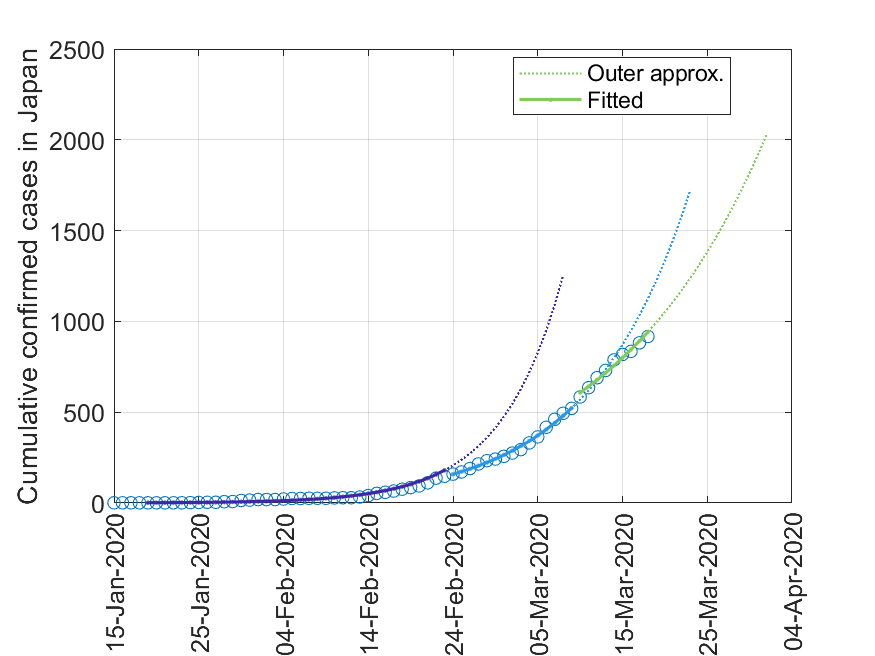
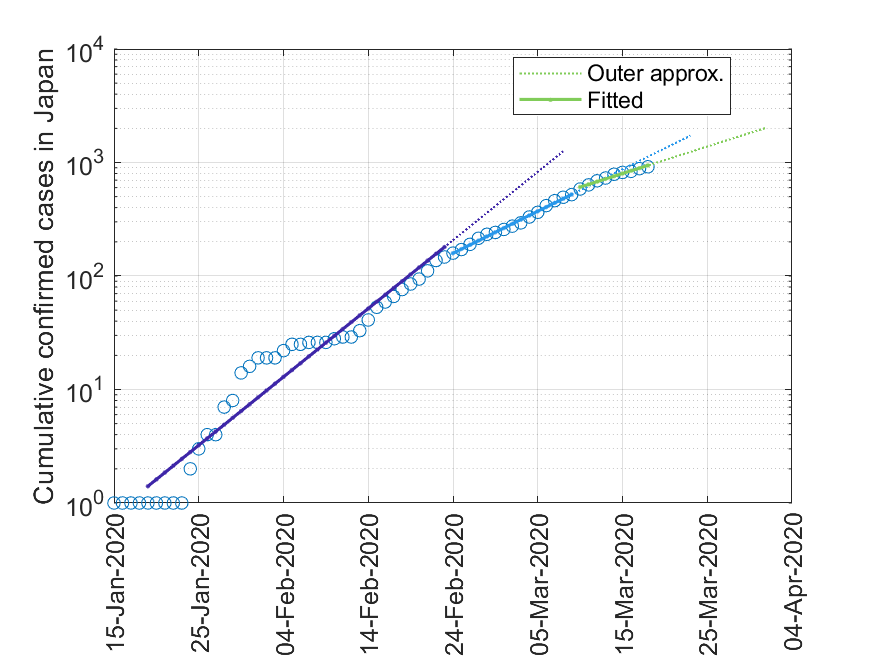
モデル出力を実データと重ねます.片対数,線形両方とも示します.
実線および点線はそれぞれ近似曲線と14日後まで外挿したものです.片対数グラフでは,データを3つの折れ線で近似してます.外挿で伸ばした値は「それまでの増え方で増え続けるとこうなる」という値ですが,実測値がいずれも下回っています.このことから,執筆日(2020年3月19日)時点ではいまだに累計者数が指数関数的に増加していますが,その勢いが少しづつ弱まっているのではないか,と読み取れます.
