小ネタです。
EBウイルスの感染による胃がん細胞の遺伝子はよくメチル化されていることが知られています。
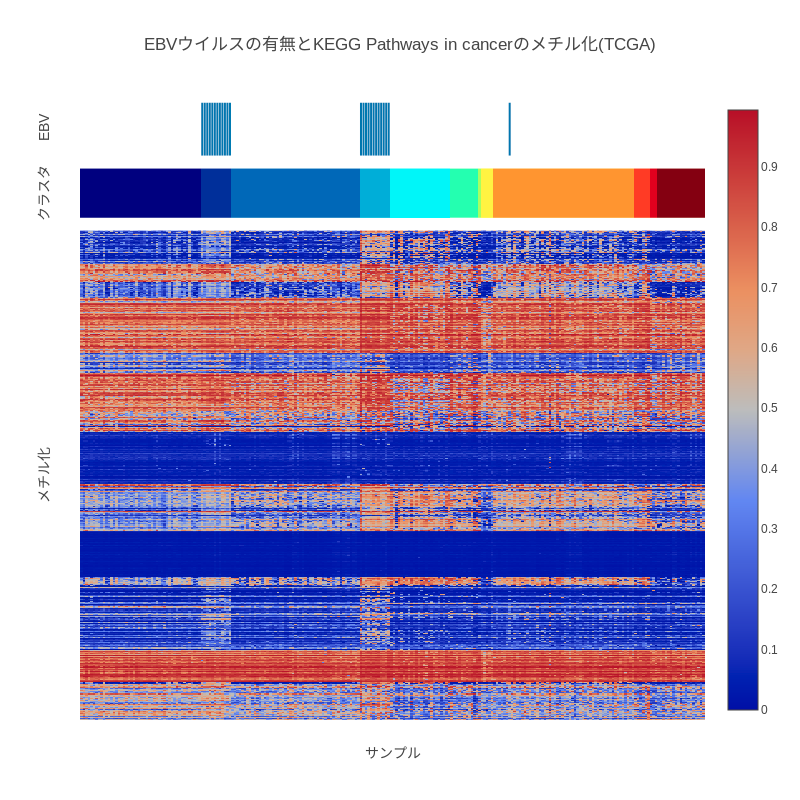
この記事では、本当にEBウイルス陽性胃癌のメチル化は特徴的なのか、TCGAのデータを使って自分でメチル化のヒートマップを描いてみます。
準備編
JupyterLab + IRuby という環境を想定しています。各種Webの情報を参考にして作ります。
gem install specific_install
# irubyのインストール
gem install ffi-rzmq
gem specific_install https://github.com/SciRuby/iruby
iruby register --force
# Daruのインストール
gem specific_install https://github.com/SciRuby/daru
# IRuby-plotlyのインストール
gem specific_install https://github.com/zach-capalbo/iruby-plotly
# daru-apiclientのインストール
gem install daru-apiclient
# Rumaleのインストール
gem install rumale
Jupyter Lab編
1. 📖 ライブラリを読み込む
require 'daru/apiclient'
require 'awesome_print'
require 'rumale'
require 'iruby/plotly'
2. 🌏 TCGA(cBioPortal)に接続する準備をする
c = Daru::APIClient.new "https://www.cbioportal.org/api"
3. 📡 STAD(胃がん)のサンプルリストを確認しておく
c.get("/studies/stad_tcga/sample-lists")
4. 📡 STAD(胃がん)の分子プロファイルを確認しておく
c.get("/studies/stad_tcga_pub/molecular-profiles")
5. 📡 TogoWS経由でがん関連遺伝子のEntrezGeneIdを取得する
## TogoWS用にクライアントの作成
tgw = Daru::APIClient.new "http://togows.org"
## 取得
cancer_genes = tgw.get "/entry/kegg-pathway/hsa05200/genes.json"
cancer_gene_ids = cancer_genes.vectors.to_a
6. 📡 メチル化のデータを取得する
methylation = c.post(
    "/molecular-profiles/stad_tcga_methylation_hm450/molecular-data/fetch",
    headers: {"Content-Type": "application/json"},
    body: {entrezGeneIds: cancer_gene_ids,
           sampleListId: "stad_tcga_methylation_hm450"}.to_json,
    timeout: 1000)
取得にはかなり時間がかかります。ここではタイムアウト1000秒で設定しています。
取得するのにそれ以上の時間がかかるとエラーになります。
7. 💾 メチル化のデータを保存する
File.binwrite("methylation.dat", Marshal.dump(methylation))
# methylation = Marshal.load(File.binread("methylation.dat"))
8. 📡 EBウイルス感染のデータを取得する
実は、EBVウイルス感染の臨床データはTCGAでははっきり登録されていないようなのです。なのでTCGA-PUBから取得する必要がありました。この点が少し厄介なところでした。
ebv = c.get "/studies/stad_tcga_pub/clinical-data",
        query: {clinicalDataType: "PATIENT", attributeId: "EBV_PRESENT"}
9. ✅ ヒートマップ作成に使える患者IDの数をチェックする
require 'set'

pid1 = ebv["patientId"].to_a.uniq # EBV感染の情報が登録されている患者ID
pid2 = methylation["patientId"].to_a.uniq # メチル化の情報が登録されている患者ID

puts pid1.size # EBV感染の情報が登録されている患者IDの数
puts pid2.size # メチル化の情報が登録されている患者IDの数
puts (pid2 & pid1).size # EBV感染の情報かつメチル化の情報が登録されている患者IDの数

# 患者IDをヒートマップ作成のプロセスにまわす
data = methylation.filter_rows{|row| (pid2 & pid1).include? row["patientId"]}
295
395
248
10. 🔧 pivotしてデータをヒートマップ用に整形する
tidyデータの扱いが弱いところがRubyのデータフレームDaruの弱点なのですが、pivotはなんとかこなします。少し時間がかかりますので見守りましょう。またnilは0で埋めることにします。
data2 = data.pivot_table(index: ["patientId"], vectors: ["entrezGeneId"], values: "value")
data3 = data2.replace_values nil, 0
11. 🔧 クラスタリング
まあ、ちょっと適当なのですが、数学的に難しいことはわからないので仕方がありません(開き直り)。
いつもどおりRumaleのGaussianMixtureを使ってクラスタリングします。
samples = Numo::DFloat.cast(data2.to_matrix.to_a)
normalizer = Rumale::Preprocessing::StandardScaler.new
samples_std = normalizer.fit_transform(samples.transpose)
samples_std = samples_std.transpose

gmm = Rumale::Clustering::GaussianMixture.new(n_clusters: 12, random_seed: 5)
pca = Rumale::Decomposition::PCA.new(n_components: 50)
samples_std_pca = pca.fit_transform(samples_std)
cluster_ids = gmm.fit_predict(samples_std_pca)
puts cluster_ids.inspect

gmm2 = Rumale::Clustering::GaussianMixture.new(n_clusters: 20, random_seed: 5)
pca2 = Rumale::Decomposition::PCA.new(n_components: 50)
samples_std_pca2 = pca2.fit_transform(samples_std.transpose)

cluster_ids2 = gmm2.fit_predict(samples_std_pca2)
puts cluster_ids2.inspect

xindex = cluster_ids.sort_index
yindex = cluster_ids2.sort_index
puts "done"
12. 🔧 X軸、Y軸のインデックスを並び替える
クラスタリングの結果に応じて並び替えます。
# もともとのインデックスの取得
x = data3.index.to_a.flatten(1)
y = data3.vectors.to_a.map{|i| "e#{i[1]}"}
# 並び替える
x2 = x.values_at *xindex.to_a
y2 = y.values_at *yindex.to_a
13. 🔧 データを並び替える
# Daru → Ruby配列
z = data3.to_matrix.transpose.to_a
# Ruby配列 → NArray配列
z2 = Numo::DFloat.cast(z)
# クラスタリング結果で並び替え。一発でもできるかも。
z3 = z2[true, xindex]
z3 = z3[yindex, true]
puts z3.inspect
14. 🔧 EBウイルス感染のあるなし
y3 = x2.map do |pid|
  ebv.filter_rows{|r| r["patientId"] == pid}["value"][0]
end
15. 📊 ヒートマップを作成する
pdata = [
{
  x: x2,
  y: y3,
  xaxis: "x1",
  yaxis: "y1",
  type: "bar"
},
{
  x: x2,
  z: [cluster_ids[xindex].to_a],
  xaxis: "x2",
  yaxis: "y2",
  type: "heatmap",
  showscale: false,
  colorscale: 'Jet'
},
{
  x: x2,
  y: y,
  z: z3.to_a,
  xaxis: "x3",
  yaxis: "y3",
  type: "heatmap"
}
]

noaxis = {
      showgrid: false,
      zeroline: false,
      showline: false,
      ticks: '',
      showticklabels: false,
}

layout = {
  title: 'EBウイルスの有無とKEGG Pathways in cancerのメチル化(TCGA)',
  xaxis: noaxis,
  xaxis2: noaxis,
  xaxis3: {
      title: "サンプル"
  }.merge(noaxis),
  yaxis: {
    domain: [0.91, 1.0],
    title: "EBV"
  }.merge(noaxis),
  yaxis2: {
    domain: [0.81, 0.89],
    title: "クラスタ"
  }.merge(noaxis),
  yaxis3: {
    domain: [0.0, 0.79],
    title: "メチル化"
  }.merge(noaxis),
  grid: {rows: 3, columns: 1, pattern: 'independent' },
  width: 800,
  height: 800
}

IRuby.plotly(pdata, layout)
どうでしょう。あきらかにEBウイルス感染している胃癌は、メチル化に特徴を認めますね。適当クラスタリングでもEBウイルスに感染しているものは見事に別れています。ひとつだけそうなってないのがありますが。
こんな感じで、わりと簡単にできるのですが、頭の中で「簡単にできるな〜」と思っても、実際に手を動かすと思ったより時間がかかりますのでなんとかしたいところです。
後半、変数名が番号呼びになっちゃって適当です。
この記事は以上です。
🦆 宣伝!! ついにRumaleのグッズが販売されたそうです!
この記事でもお世話になってるRubyの機械学習用ライブラリのRumaleのファングッズが発売されました。
Rumale Tシャツの販売をはじめました https://t.co/MfmnxQJWum
— 洋食 (@y0shoku) July 11, 2019
買いましょう。個人的にはマグカップがほしいです ← ない