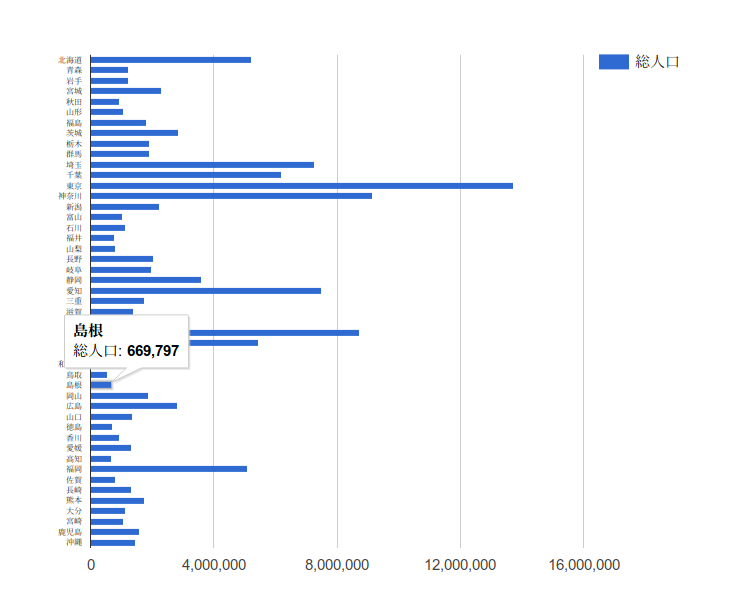
都道府県別のデータをRESAS-APIから取得してDaru::Viewでグラフを描いてみました。本家のサンプルに国ごとのマップを描く方法は載っていますが、県別にマップに色つけする方法がなかったので記録を残します。
前提となる環境
- Jupyter Notebook / Lab
- IRuby
Daru::Viewとは?
Ruby用のデータフレーム Daru のライブラリ。バックエンドにGoogle Chartsや、Highchartsを利用する。Google Chartsの基本的な機能はほぼカバーされている。
https://github.com/SciRuby/daru-view
require 'daru/view'
require 'resas_kit'
RESAS-APIから情報の取得するのはResasKitというGemを利用した。(Qiitaに作者による解説記事があります)
client = ResasKit::Client.new(api_key: KEY) # キー取得には登録が必要
都道府県のリストを取得。あとでGoogle Chartに投げるために「県」「都」「府」を消しておきます。
prefs = client.get('prefectures').body.result.map do |item|
    name = item.prefName
    name.chop! unless name == "北海道"
    [name, item.prefCode]
end
# [["北海道", 1],
# ["青森", 2],
# ["岩手", 3],
# ...
# ["沖縄", 47]]
都道府県別の総人口を取得する
今回は練習のため、県ごとの総人口を取得してみます。
データの取得
県別のデータを一括して取得する方法がわからなかったので、ここではループをまわして取得しています。
population_data = prefs.map do |name, n|
    hoge = client.get 'population/composition/perYear', pref_code: n
    value = hoge.body.result.data[0].data[12].value # 12 は 2020年のデータ
    population_data << [name, value]
end
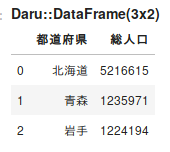
データフレームの作成
df = Daru::DataFrame.rows(population_data)
df.vectors = Daru::Index.new ["都道府県","総人口"]
df.head 3 # 上から3行を表示して確認
今回は使いませんが、nilの除去をする場合は下記のようにしたりします。
df.replace_values nil, 0 # nilを0に変換する
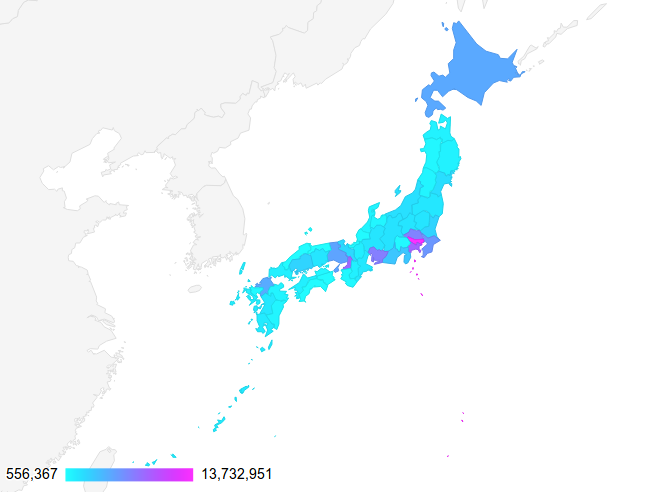
都道府県のチャートを描く
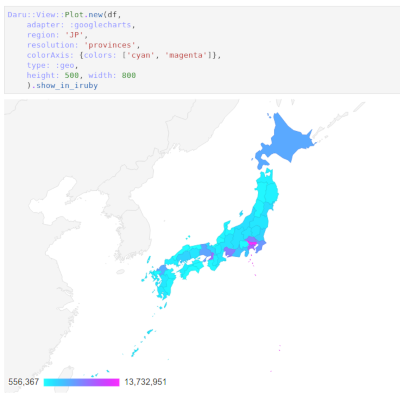
Daru::View::Plot.new(df,
    adapter: :googlecharts,
    region: 'JP',
    resolution: 'provinces',
    type: :geo,
    height: 500, width: 800
    ).show_in_iruby
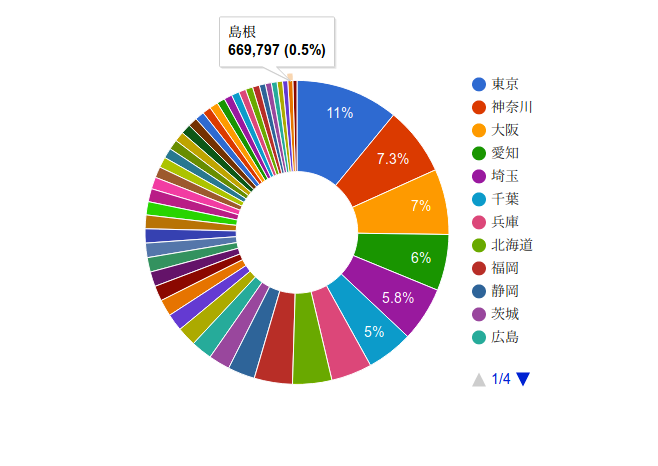
おまけで、円グラフや棒グラフも描いておきましょう。
円グラフ
df2 = df.sort(["総人口"], ascending: false)
# ↑ ソートをかけた
Daru::View::Plot.new(df2,
    type: :pie,
    height: 500, width: 800
    ).show_in_iruby
棒グラフ
Daru::View::Plot.new(df,
    adapter: :googlecharts,
    type: :bar,
    vAxis: {textStyle: {fontSize: 8}},
    height: 800, width: 800
    ).show_in_iruby
上記のコードを少し書き換えるだけでも、さまざまなグラフが作成できそうです。
Pythonのすばらしい可視化ライブラリには遠く及びませんが、使用頻度の高い古典的なグラフについてはかなり便利に使えるのではないでしょうか。
余談ですが、上記の簡単なコードを書くのには実はそれなりに時間がかかっています。初めて見たAPIで何の情報がどこに格納されているかを探すのに、かなり時間がかかるようです。
この記事は以上です。
