DynamoDBのCapacityUnitsの実際の使用量を割合で出力する
この記事を書くために調べている間に、まったく同じ機能としてAWSから「CloudWatch Metric Math」なるものが発表されて(しかも知らないで勉強会で発表してフィードバックをもらう、という)軽くショックを受けたので、早速Lambdaから呼んでみた備忘録。
使い方
公式ページに詳しく書かれているので、こちらを見るのが良いかと。
やりたいこと
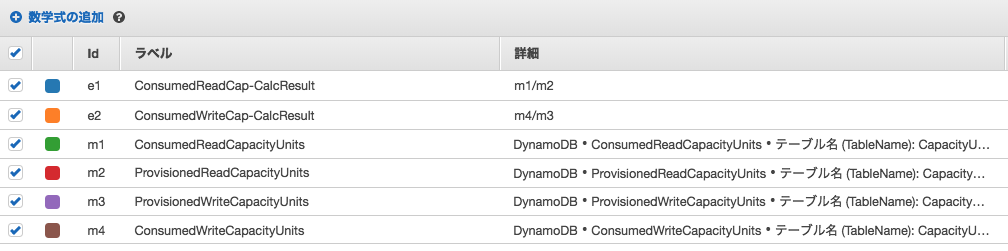
CloudWatch Metricの画面に設定できる、e1, e2部分の計算結果をLambdaから取得できるようにします。
Lambdaから呼んでみる
公式ページにもある通り、現在はget_metric_dataから取得ができるようです。こんな感じでサンプルページを参考にすれば取得できました。
    response = client.get_metric_data(
    MetricDataQueries=[
        {
            'Id': 'm1',
            'MetricStat': {
                'Metric': {
                    'Namespace': 'AWS/DynamoDB',
                    'MetricName': 'ProvisionedReadCapacityUnits',
                    'Dimensions': [
                        {
                            'Name': 'TableName',
                            'Value': 'CapacityUnitsTest'
                        },
                    ]
                },
                'Period': 300,
                'Stat': 'Average',
                'Unit': 'Count'
            },
            'Label': 'CalculationResult',
            'ReturnData': True
        },
        {
            'Id': 'm2',
            'MetricStat': {
                'Metric': {
                    'Namespace': 'AWS/DynamoDB',
                    'MetricName': 'ConsumedReadCapacityUnits',
                    'Dimensions': [
                        {
                            'Name': 'TableName',
                            'Value': 'CapacityUnitsTest'
                        },
                    ]
                },
                'Period': 300,
                'Stat': 'Average',
                'Unit': 'Count'
            },
            'Label': 'CalculationResult',
            'ReturnData': True
        },
        {
            'Id': 'calculationResult',
            'Expression': 'm2/m1',
            'Label': 'CalculationResult',
            'ReturnData': True
        }
    ],
    StartTime=start_time,
    EndTime=end_time
    )
計算対象を定義しておいて、(m1、m2)、それらを使うメトリクスを「Expression」として定義すると取得できるようです。
{
  "MetricDataResults": [
    {
      "Id": "m1",
      "Label": "CalculationResult",
      "Timestamps": [
        datetime.datetime(2018,4,22,3,38,tzinfo=tzlocal()),
        datetime.datetime(2018,4,22,3,28, tzinfo=tzlocal()),
        datetime.datetime(2018,4,22,3,18, tzinfo=tzlocal()),
        datetime.datetime(2018,4,22,3,8, tzinfo=tzlocal()),
        datetime.datetime(2018,4,22,3,3, tzinfo=tzlocal()),
        datetime.datetime(2018,4,22,2,53, tzinfo=tzlocal())
      ],
      "Values": [3.0,3.0,3.0,3.0,3.0,3.0],
      "StatusCode": "Complete"
    },
    {
      "Id": "m2",
      "Label": "CalculationResult",
      "Timestamps": [
        datetime.datetime(2018,4,22,3,43, tzinfo=tzlocal()),
        datetime.datetime(2018,4,22,3,38, tzinfo=tzlocal()),
        datetime.datetime(2018,4,22,3,33, tzinfo=tzlocal()),
        datetime.datetime(2018,4,22,3,28, tzinfo=tzlocal()),
        datetime.datetime(2018,4,22,3,23, tzinfo=tzlocal()),
        datetime.datetime(20184,22,3,18, tzinfo=tzlocal()),
        datetime.datetime(2018,4,22,3,13, tzinfo=tzlocal()),
        datetime.datetime(2018,4,22,3,8, tzinfo=tzlocal()),
        datetime.datetime(2018,4,22,3,3, tzinfo=tzlocal()),
        datetime.datetime(2018,4,22,2,58, tzinfo=tzlocal()),
        datetime.datetime(2018,4,22,2,53, tzinfo=tzlocal()),
        datetime.datetime(2018,4,22,2,48, tzinfo=tzlocal())
      ],
      "Values": [1.5,1.5,1.5,1.5,1.5,1.5,1.5,1.5,1.5,1.5,1.5,1.5],
      "StatusCode": "Complete"
    },
    {
      "Id": "calculationResult",
      "Label": "CalculationResult",
      "Timestamps": [
        datetime.datetime(2018,4,22,3,43, tzinfo=tzlocal()),
        datetime.datetime(2018,4,22,3,38, tzinfo=tzlocal()),
        datetime.datetime(2018,4,22,3,33, tzinfo=tzlocal()),
        datetime.datetime(2018,4,22,3,28, tzinfo=tzlocal()),
        datetime.datetime(2018,4,22,3,23, tzinfo=tzlocal()),
        datetime.datetime(2018,4,22,3,18, tzinfo=tzlocal()),
        datetime.datetime(2018,4,22,3,13, tzinfo=tzlocal()),
        datetime.datetime(2018,4,22,3,8, tzinfo=tzlocal()),
        datetime.datetime(2018,4,22,3,3, tzinfo=tzlocal()),
        datetime.datetime(2018,4,22,2,58, tzinfo=tzlocal()),
        datetime.datetime(2018,4,22,2,53, tzinfo=tzlocal()),
        datetime.datetime(2018,4,22,2,48, tzinfo=tzlocal())
      ],
      "Values": [0.5, 0.5, 0.5, 0.5, 0.5, 0.5],
      "StatusCode": "Complete"
    }
  ],
  "ResponseMetadata": {
    "RequestId": "f3a30214-45df-11e8-b3c0-b717d165681e",
    "HTTPStatusCode": 200,
    "HTTPHeaders": {
      "x-amzn-requestid": "f3a30214-45df-11e8-b3c0-b717d165681e",
      "content-type": "text/xml",
      "content-length": "3331",
      "vary": "Accept-Encoding",
      "date": "Sun, 22 Apr 2018 03:48:00 GMT"
    },
    "RetryAttempts": 0
  }
}
取得はできましたが、計算結果が歯抜けの様になっています。(0.0が時折混じる)おそらくはProvisionedCcapacityUnitsとConsumedCapacityUnitsの出力タイミングなどが関係しているのでしょうが、詳しくは分からず。わかる方いたら教えてもらえるとありがたいっす。
追記:
計算を「m1(ProvisionedReadCapacityUnits)/m2(ConsumedReadCapacityUnits)」にしてしまっていたため、データ数の少ないProvisionedReadCapacityUnits側が、0で埋められてしまった様に見えます。計算式を正しく「m1/m2」にしたところ、0で埋められることなく出力されました(コードや結果は修正済み)
ちなみにget_metric_statiticsからの取得はできない模様
公式には書いていませんが、AWS Console上で設定ができるのであれば、それを一メトリクスとして他と同じ様に取得できるのではないかと考えたわけです。以前作った処理を改造してこんな感じにしてみました。これで取得できれば一番簡単なんですけどね。
def lambda_handler(event, context):
    start_time = datetime.datetime.utcnow() - datetime.timedelta(minutes=60)
    end_time = datetime.datetime.utcnow()
    period = 300

    consumed_read_calc_result_parameters = {
        'namespace': 'AWS/DynamoDB',
        'metric_name': 'ConsumedReadCap-CalcResult',
        'dimension_name': 'TableName',
        'dimension_value': 'CapacityUnitsTest',
        'start_time': start_time,
        'end_time': end_time,
        'period': period,
        'statistics': ['Average'],
        'unit': 'Count'
    }

    metric_calc_read_cap = get_metrics(consumed_read_calc_result_parameters)
    print(metric_calc_read_cap)
    return 'Success'

def get_metrics(parameters):
    client = boto3.client('cloudwatch')

    metrics = client.get_metric_statistics(
                            Namespace=parameters['namespace'],
                            MetricName=parameters['metric_name'],
                            Dimensions=[
                                {
                                    'Name': parameters['dimension_name'],
                                    'Value': parameters['dimension_value']
                                }
                            ],
        StartTime=parameters['start_time'],
        EndTime=parameters['end_time'],
        Period=parameters['period'],
        Statistics=parameters['statistics'],
        Unit=parameters['unit'])

    return metrics
結果はやっぱり取れませんでしたが。どれだけ待っても、取得期間を大きくしてもDataPointsにデータが入ることはありませんでした。
{
  "Label": "ConsumedReadCap-CalcResult",
  "Datapoints": [],
  "ResponseMetadata": {
    "RequestId": "d409f8a7-4619-11e8-9c95-99fc6d9fcd0f",
    "HTTPStatusCode": 200,
    "HTTPHeaders": {
      "x-amzn-requestid": "d409f8a7-4619-11e8-9c95-99fc6d9fcd0f",
      "content-type": "text/xml",
      "content-length": "349",
      "date": "Sun, 22 Apr 2018 10:42:17 GMT"
    }
  }
}
まとめ
Lambdaから呼べるには呼べましたが、そこまで嬉しいポイントがまだ見えてない感じが・・・(^^;途中歯抜けになってしまうあたりが解消すれば、もう少し恩恵を受けられている、という感じはします。設定でうまくいくのか、もう少し調査が必要です。
上述の通り、歯抜けのデータは解消することができたので、Lambdaを自作して個別に呼び出すよりもずっと便利に簡単に使えそうです。