はじめに
Google Colabを学びたいStep5です。今回はヒートマップを描いていきます。
成果物
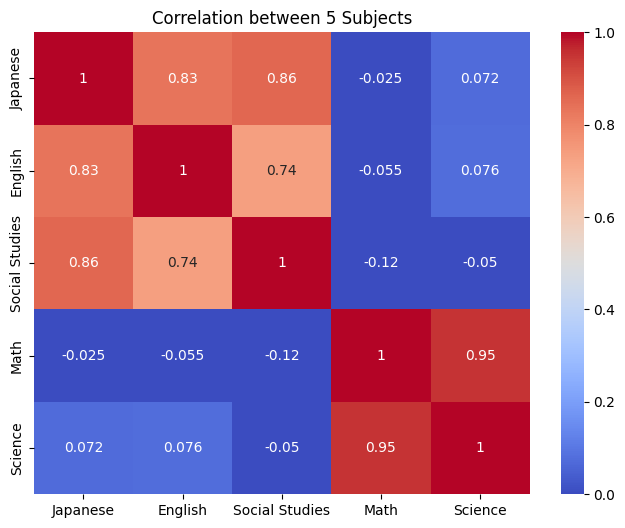
国語、数学、英語、社会、理科の5教科のヒートマップを作成する。
相関関係をわかりやすくするため、国語と英語と社会は相関係数を強くし、数学・理科の相関係数を強くして表示しています。

ソースコード
# ライブラリをインポート
import numpy as np
import pandas as pd
import seaborn as sns
import matplotlib.pyplot as plt

# データ数(20人分の成績)
np.random.seed(42)

# 文系(国語・英語・社会)に似た傾向を持たせる
japanese = np.random.normal(75, 5, 20)
english = japanese + np.random.normal(0, 3, 20)
social_studies = japanese + np.random.normal(0, 3, 20)

# 理系(数学・理科)に似た傾向を持たせる
math = np.random.normal(70, 6, 20)
science = math + np.random.normal(0, 3, 20)

# データフレームにまとめる
df = pd.DataFrame({
    'Japanese': japanese,
    'English': english,
    'Social Studies': social_studies,
    'Math': math,
    'Science': science
})

# 相関行列を計算
corr = df.corr()

# ヒートマップを描画
plt.figure(figsize=(8, 6))
sns.heatmap(corr, annot=True, cmap='coolwarm', vmin=0, vmax=1)
plt.title("Correlation between 5 Subjects")
plt.show()