はじめに
Rを学びたいStep2です。ベクトルの結果を画像表示できるようにしています。
ソースコード
plot.R
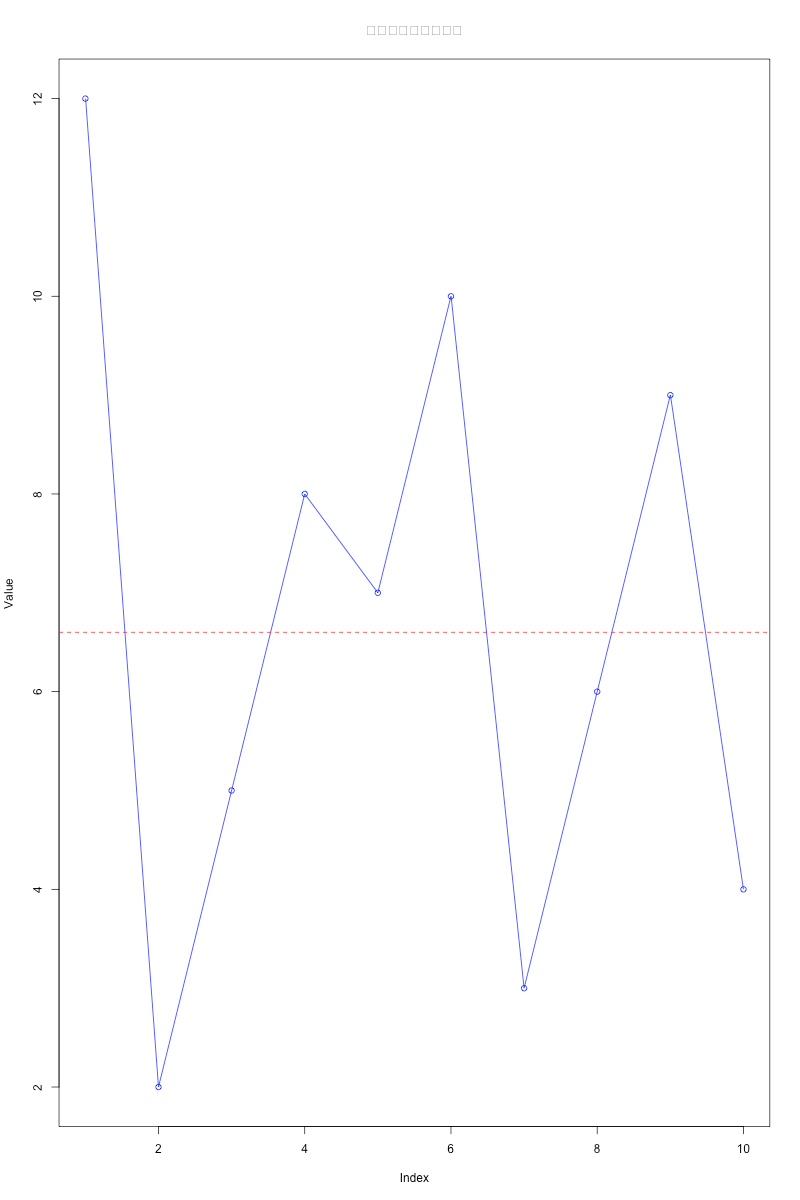
# ベクトルの作成
val <- c(12, 2, 5, 8, 7, 10, 3, 6, 9, 4)

# ベクトルの内容を表示
print("ベクトルの内容:")
print(val)

# プロットの作成
plot(val, type = "o", col = "blue", xlab = "Index", ylab = "Value", main = "ベクトルのプロット")

# 平均値の計算
average_val <- mean(val)
cat("平均値:", average_val, "\n")

# 平均値のラインを追加
abline(h = average_val, col = "red", lty = 2)