はじめに
ポテンシャル法を使ってpythonでグラフを書いてみたが、参考にしたサイト、論文を紹介します。
使用環境
google clab
Python
-matplotlib
-seaborn
-pandas
-numpy
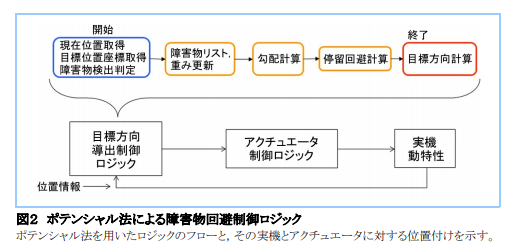
ポテンシャル法
ロボットの障害物回避などに使われる。障害物と目的地にポテンシャル関数を定義してそれの勾配にそった経路で目的地までの経路を出すという経路計画法です。
障害物は山となるようなポテンシャル関数、目的地には谷となるようなポテンシャル関数を定義して坂にはのぼらず谷の方に移動していくというイメージです。
参考論文(ポテンシャル法と検索して一番最初に出てきた。何も知らなかったが、とても分かりやすかったです。)
https://www.mhi.co.jp/technology/review/pdf/511/511040.pdf
pythonでの実装
matplotlibと、pandas、numpy、見た目用にseabornを使いました。
ポテンシャル場の3Dグラフと、経路の2Dグラフを作ってみました。

実際のコード
とりあえず動くものを
参考サイト、このCをPythonに書き換えた感じです。
http://gpsnmeajp.sblo.jp/article/181155338.html
potential_field.py
import math
import pandas as pd
import numpy as np
import matplotlib.pyplot as plt
from mpl_toolkits.mplot3d import Axes3D
from matplotlib import cm
import seaborn as sns
%matplotlib inline
sns.set()

# ポテンシャル関数の計算
def cal_pot(x, y):
  tmp_pot = 0

  #障害物の数だけ繰り返す
  for i in range(0,len(obst)):
    #障害物の座標はmax
    if obst_x[i] == x and obst_y[i] == y:
      obst_pot = potential_max
    else:
      obst_pot =  1 / math.sqrt(pow((x - obst_x[i]), 2) + pow((y - obst_y[i]), 2))
      obst_pot += obst_pot * weight_obst
    tmp_pot += obst_pot

  #ゴールの座標はmin
  if goal_x == x and goal_y == y:
    goal_pot = potential_min
  else:
    goal_pot   = -1 / math.sqrt(pow((x - goal_x),  2) + pow((y - goal_y),  2))

  pot_all    = tmp_pot + weight_goal * goal_pot
  return pot_all

# ルートをdfに代入
def cal_route(x, y, df):
  count = 0
  while True:
    count += 1
    vx = -(cal_pot(x + delt, y) - cal_pot(x, y)) / delt
    vy = -(cal_pot(x, y + delt) - cal_pot(x, y)) / delt

    v = math.sqrt(vx * vx + vy * vy)

    vx /= v / speed
    vy /= v / speed

    x += vx
    y += vy
    tmp = pd.Series([x, y, vx, vy], index = df.columns)

    df = df.append(tmp,ignore_index = True)
    if goal_x - x < 0.1 and goal_y - y < 0.1:
      break
    if count > 10000:
      break
  return df
# print(df)

# ルートグラフ化
def plot_route(df):
  plt.scatter(df['x'],df['y'])
  #スタート、ゴール、障害物をプロット
  plt.plot(start_x  , start_y  , marker = 's', color = 'b', markersize = 15)
  plt.plot(goal_x   , goal_y   , marker = 's', color = 'b', markersize = 15)
  for i in range(0,len(obst)):
    plt.plot(obst_x[i], obst_y[i], marker = 's', color = 'r', markersize = 10)

  plt.xlim([x_min, x_max])
  plt.ylim([y_min, y_max])
  plt.show()

# ポテンシャル場グラフ化
def plot3d(U,xm,ym):
    # グラフ表示の設定
    plt.figure(figsize=(6,4))
    fig = plt.figure(facecolor="w")
    ax = fig.add_subplot(111, projection="3d")
    ax.tick_params(labelsize=7)    # 軸のフォントサイズ
    ax.set_xlabel("x", fontsize=10)
    ax.set_ylabel("y", fontsize=10)
    ax.set_zlabel("U", fontsize=10)
#     surf = ax.plot_surface(xm, ym, U, rstride=1, cstride=1,linewidth=1, antialiased=True, cmap='bwr')
    surf = ax.plot_surface(xm, ym, U, rstride=1, cstride=1, cmap=cm.coolwarm)
    plt.show()

# ポテンシャル場の計算
def cal_potential_field():
  pot = []
  for y_for_pot in range(y_min, x_max + 1):
    tmp_pot = []
    for x_for_pot in range(y_min, y_max + 1):

      potential = cal_pot(x_for_pot, y_for_pot)

      #max,minの範囲内にする
      if potential > potential_max:
        potential = potential_max
      elif potential < potential_min:
        potential = potential_min

      tmp_pot.append(potential)
    pot.append(tmp_pot)

  pot = np.array(pot)
  return pot

# スタートとゴール
start_x, start_y   = 1, 1
goal_x , goal_y    = 45, 45
# 障害物の座標(何個でも可)
obst = [[10, 40],[5, 30],[15, 40]]
# obst = []
# for i in range(10):
#   obst.append([-30 + i, i])
obst_x = []
obst_y = []
for i in range(len(obst)):
  obst_x.append(obst[i][0])
  obst_y.append(obst[i][1])

# 微分と進むスピード
delt  = 0.01
speed = 0.1
# 障害物とゴールの重みづけ
weight_obst, weight_goal = 0.1, 10
# それぞれの軸の範囲
x_min, y_min = 0, 0
x_max, y_max = 50, 50
# ポテンシャルの最大値、最小値
potential_max, potential_min = 1, -1

pot = cal_potential_field()
x_plot, y_plot = np.meshgrid(np.arange(x_min, x_max + 1),np.arange(y_min, y_max +1))
plot3d(pot, x_plot, y_plot)

df = pd.DataFrame(columns=['x','y','vx','vy'])
df = cal_route(start_x, start_y, df)
plot_route(df)
次やること
重みづけの更新とかはやらないといけないですね