概要
タイトルのとおりですが、Android のグラフライブラリ MPAndroidChart の X 軸に日付を表示する方法させる方法になります。

「Android MPAndroidChart」 で検索するとざっくりとした使用方法は出てくるのですが
こういう細かい内容のものがあまりなかったので記事にしておきます。
参考になると幸いです。
実装
さっそくサンプルコードです。
open class MainActivity : AppCompatActivity() {

    override fun onCreate(savedInstanceState: Bundle?) {
        super.onCreate(savedInstanceState)

        setContentView(R.layout.activity_main)

        // X 軸ごとの Y 軸
        val entries: MutableList<Int> = mutableListOf(
            105,
            129,
            85,
            104,
            52,
            84,
            114
        )

        // X 軸のタイムスタンプ
        val entriesTimestampMills: MutableList<Long> = mutableListOf(
            1614524400000,  // 2021/03/01 00:00:00
            1614610800000,  // 2021/03/02 00:00:00
            1614697200000,  // 2021/03/03 00:00:00
            1614783600000,  // 2021/03/04 00:00:00
            1614870000000,  // 2021/03/05 00:00:00
            1614956400000,  // 2021/03/06 00:00:00
            1615042800000   // 2021/03/07 00:00:00
        )

        // グラフに描画するデータの設定
        val entryList = entries.mapIndexed { index, entry ->
            BarEntry(
                index.toFloat(),    // X 軸 ここに渡すのはあくまで 0, 1, 2... という index
                entry.toFloat()     // Y 軸
            )
        }

        val barDataSet = BarDataSet(entryList, "barChart")
        barDataSet.setDrawValues(false)

        barChart.data = BarData(mutableListOf<IBarDataSet>(barDataSet))
        barChart.setDrawGridBackground(false)
        barChart.description.isEnabled = false

        barChart.legend.apply {
            isEnabled = false
        }

        // X 軸のフォーマッター
        val xAxisFormatter = object : ValueFormatter() {
            private var simpleDateFormat: SimpleDateFormat =
                SimpleDateFormat("M/d", Locale.getDefault())

            override fun getFormattedValue(value: Float): String {
                // value には 0, 1, 2... という index が入ってくるので
                // index からタイムスタンプを取得する
                val timestampMills = entriesTimestampMills[value.toInt()]
                val date = Date(timestampMills)
                return simpleDateFormat.format(date)
            }
        }

        // X 軸の設定
        barChart.xAxis.apply {
            position = XAxis.XAxisPosition.BOTTOM
            valueFormatter = xAxisFormatter
            setDrawGridLines(false)
        }

        // Y 軸(左)の設定
        barChart.axisLeft.apply {
            setDrawGridLines(true)
            axisMinimum = 0f
        }

        // Y 軸(右)の設定
        barChart.axisRight.apply {
            isEnabled = false
        }

        // グラフ描画
        barChart.invalidate()
    }
}
<?xml version="1.0" encoding="utf-8"?>
<androidx.constraintlayout.widget.ConstraintLayout xmlns:android="http://schemas.android.com/apk/res/android"
    xmlns:app="http://schemas.android.com/apk/res-auto"
    android:layout_width="match_parent"
    android:layout_height="match_parent">

    <com.github.mikephil.charting.charts.BarChart
        android:id="@+id/barChart"
        android:layout_width="match_parent"
        android:layout_height="300dp"
        app:layout_constraintTop_toTopOf="parent" />

</androidx.constraintlayout.widget.ConstraintLayout>
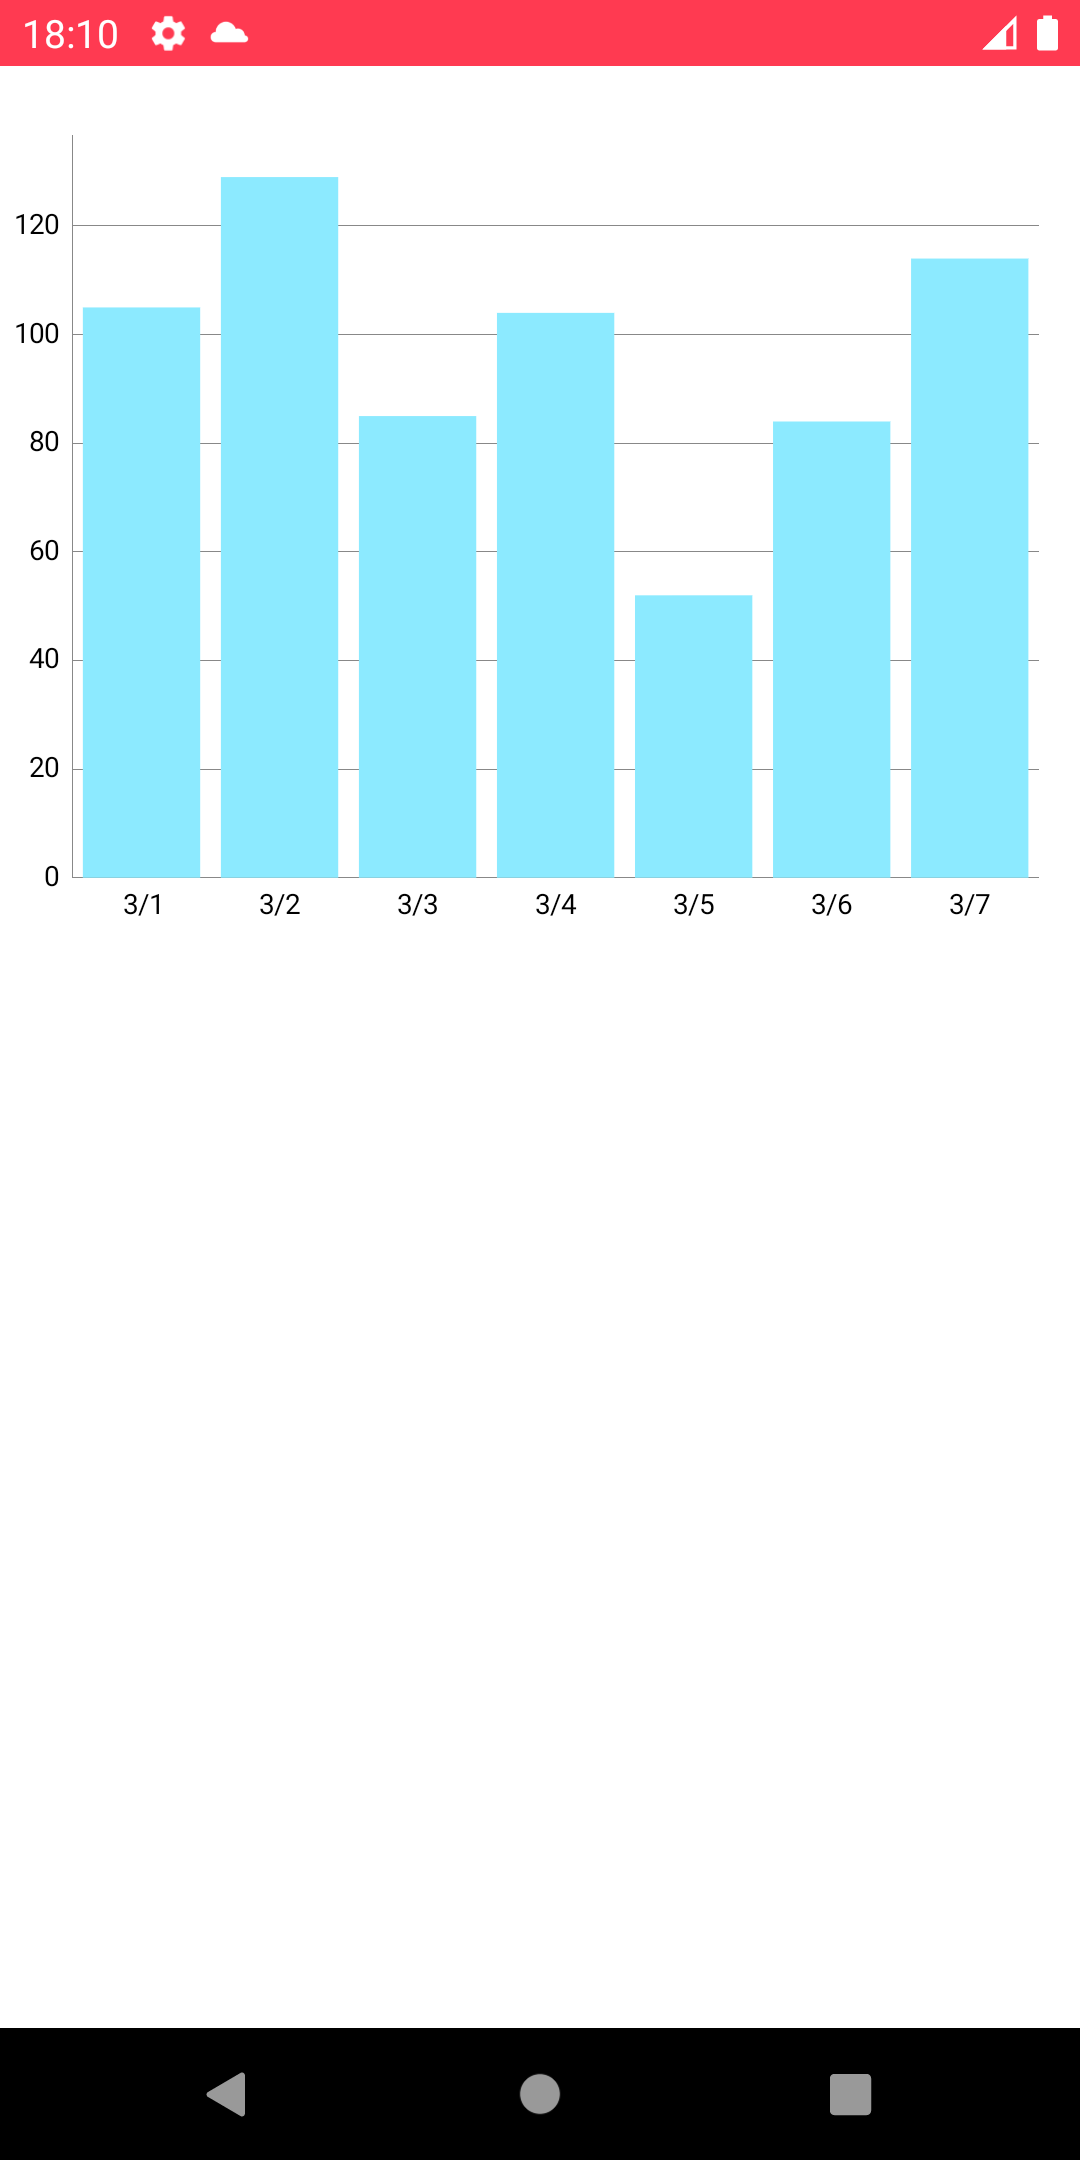
上記サンプルコードを実行すると以下のような画面が表示できると思います。
解説
ポイントとなるのは X 軸のタイムスタンプを別で管理する というところです。
順に解説していきます。
        // X 軸ごとの Y 軸
        val entries: MutableList<Int> = mutableListOf(
            105,
            129,
            85,
            104,
            52,
            84,
            114
        )

        // X 軸のタイムスタンプ
        val entriesTimestampMills: MutableList<Long> = mutableListOf(
            1614524400000,  // 2021/03/01 00:00:00
            1614610800000,  // 2021/03/02 00:00:00
            1614697200000,  // 2021/03/03 00:00:00
            1614783600000,  // 2021/03/04 00:00:00
            1614870000000,  // 2021/03/05 00:00:00
            1614956400000,  // 2021/03/06 00:00:00
            1615042800000   // 2021/03/07 00:00:00
        )
テストデータです。
entriesTimestampMills でタイムスタンプを管理しています。
        // グラフに描画するデータの設定
        val entryList = entries.mapIndexed { index, entry ->
            BarEntry(
                index.toFloat(),    // X 軸 ここに渡すのはあくまで 0, 1, 2... という index
                entry.toFloat()     // Y 軸
            )
        }
グラフに描画するデータ BarEntry に X 軸と Y 軸の値をセットしてます。
このサンプルコードの場合 entryList には 7つ の BarEntry が格納されます。
        // X 軸のフォーマッター
        val xAxisFormatter = object : ValueFormatter() {
            private var simpleDateFormat: SimpleDateFormat =
                SimpleDateFormat("M/d", Locale.getDefault())

            override fun getFormattedValue(value: Float): String {
                // value には 0, 1, 2... という index が入ってくるので
                // index からタイムスタンプを取得する
                val timestampMills = entriesTimestampMills[value.toInt()]
                val date = Date(timestampMills)
                return simpleDateFormat.format(date)
            }
        }

        // X 軸の設定
        barChart.xAxis.apply {
            position = XAxis.XAxisPosition.BOTTOM
            valueFormatter = xAxisFormatter
            setDrawGridLines(false)
        }
interface ValueFormatter() を実装し、 X 軸の valueFormatter に設定します。
コード内のコメントにも記載していますが、getFormattedValue(value: Float) の value には BarEntry の X 軸として設定した値が渡されます。
BarEntry の X 軸には entries の index である 0, 1, 2... を設定しています。
X 軸: 0 に格納されているタイムスタンプを entriesTimestampMills から取得し、日付フォーマットして 3/1 と表示する、といった具合です。
なぜ別で管理するのか
なぜこのような実装にしたのかを備忘録として残しておきます。
興味がある方はこちらもご覧ください。
最初に思いついたのは以下のような実装でした。
        ...
        // `MutableMap` にして Key にタイムスタンプを持たせる
        val entries: MutableMap<Long, Int> = mutableMapOf(
            1614524400000 to 105,
            1614610800000 to 129,
            1614697200000 to 85,
            1614783600000 to 104,
            1614870000000 to 52,
            1614956400000 to 84,
            1615042800000 to 114
        )
        ...
        // `BarEntry` の X 軸にタイムスタンプを設定
        val entryList = entries.map { (timestampMills, entry) ->
            BarEntry(
                timestampMills.toFloat(),
                entry.toFloat()
            )
        }
        ...
        // X 軸のフォーマッターでタイムスタンプを受け取って日付にフォーマット
        val xAxisFormatter = object : ValueFormatter() {
            private var simpleDateFormat: SimpleDateFormat =
                SimpleDateFormat("M/d", Locale.getDefault())

            override fun getFormattedValue(value: Float): String {
                val date = Date(value.toLong())
                return simpleDateFormat.format(date)
            }
        }
        ...
上記コードを実行すると
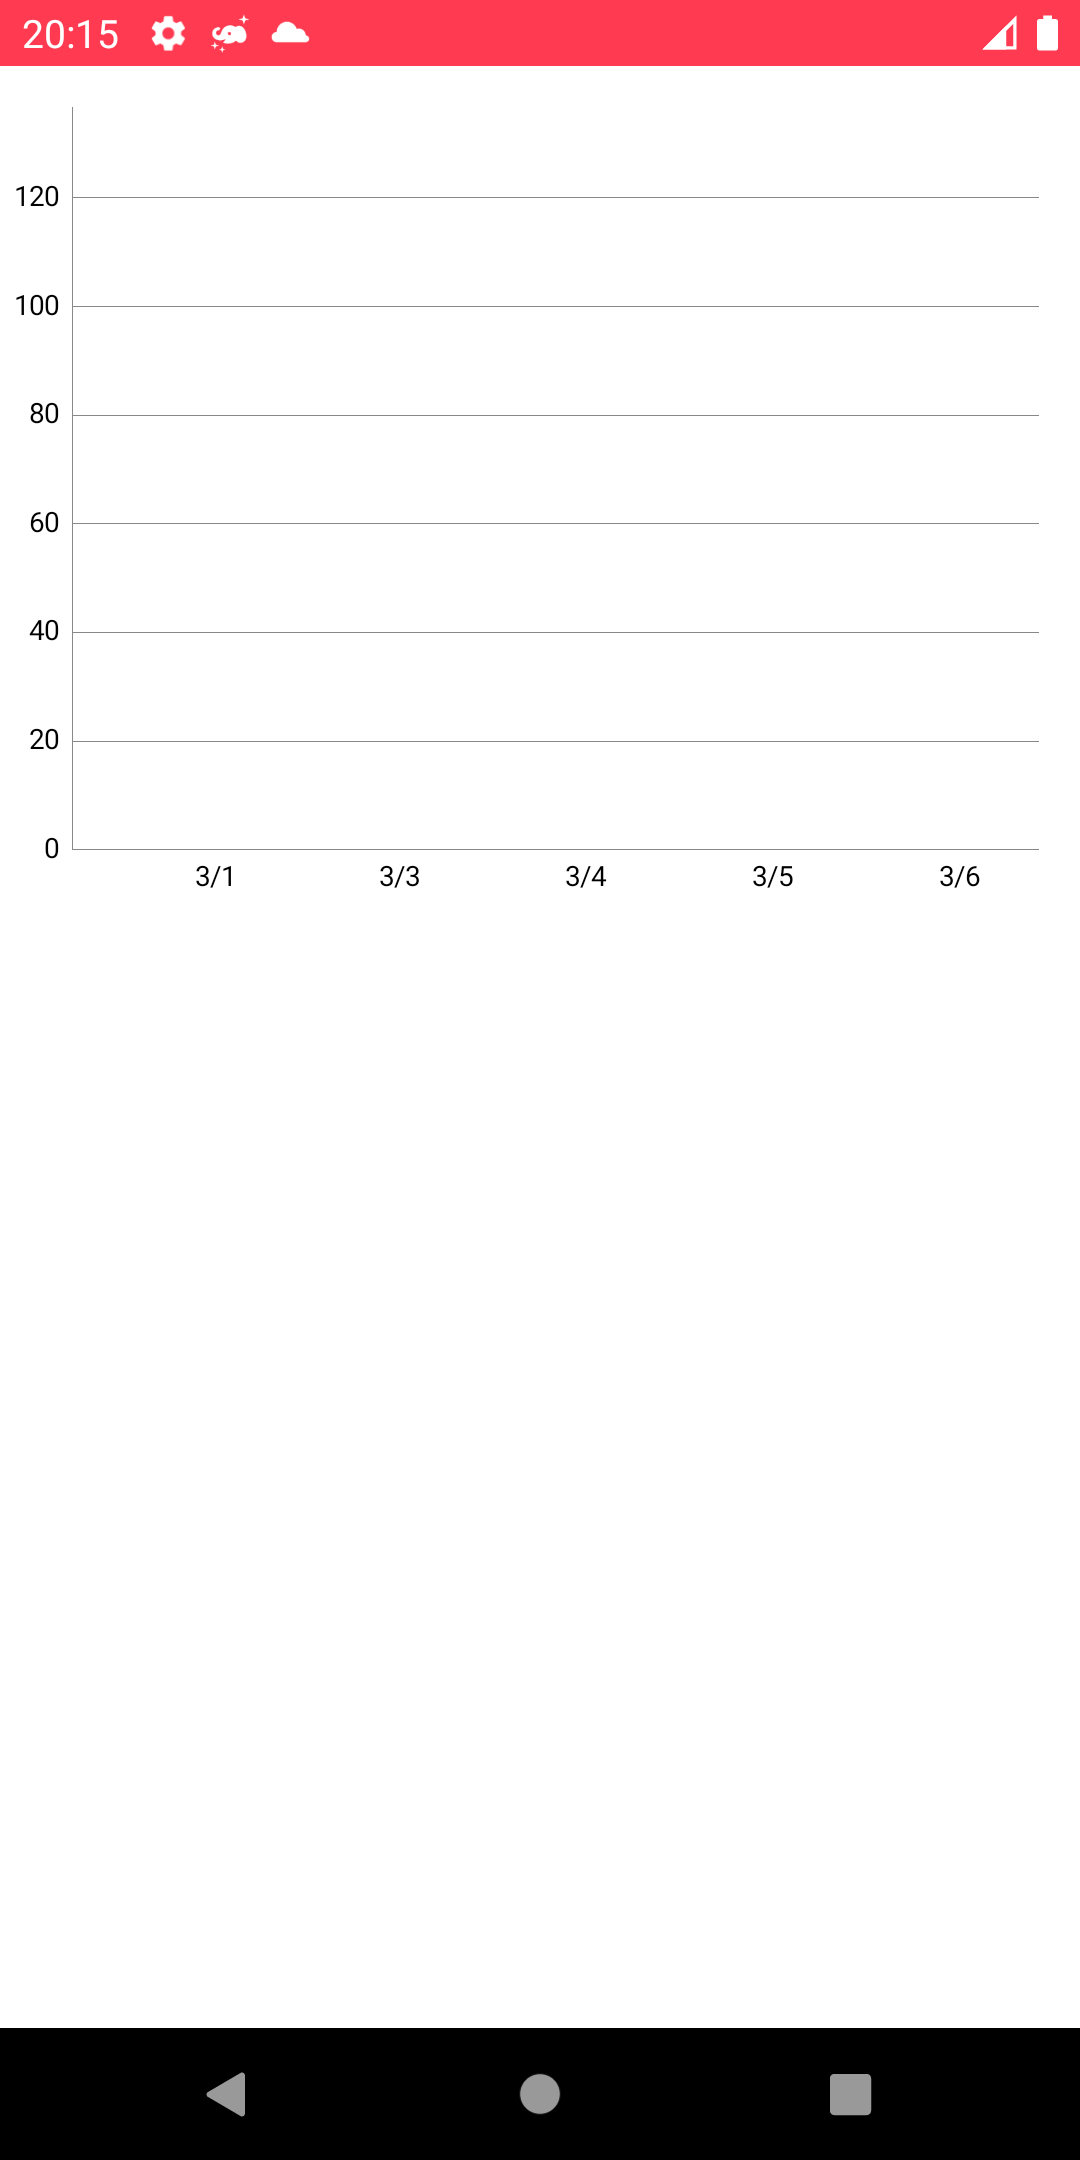
真っ白なグラフになってしまいました。
なぜ真っ白になるのか調査した結果、問題となっていたコードは
timestampMills.toFloat(),
タイムスタンプを Float に変換している箇所でした。
タイムスタンプを Float に変換することで値が丸められ、Float から Long へ戻したときに
1614524400000 (2021/03/01 00:00:00) → 1614599946240 (2021/03/01 20:59:06)
1614610800000 (2021/03/02 00:00:00) → 1614699954176 (2021/03/03 00:45:54)
のように実際の値と変わっていました。
そのせいでうまくグラフの描画ができなかったのだと思われます。
タイムスタンプを Long ではなく Int でも試してみましたが結果は変わらず真っ白でした。
Float の変換のところでおかしな値になってるので、 BarEntry に Float 以外の値を渡せないかも調べましたが見当たらず、、、
試行錯誤した結果 X 軸のタイムスタンプを別で管理する に落ち着いた次第です。