概要
機械学習など学んでいると、様々なモデルや手法など学んでいくと思います。
筆者のような機械学習を学びはじめ経験など乏しいと特徴量の選択やモデルの決定など難しく感じます。
決定はそもそもの経験やドメイン知識など様々な要素から決定されると想像できますが、それらに加えて決定の助けになるもの手法を今現在学んだものを整理した内容が本記事になります。
また現在キャリアチェンジとして学んでる側面があるため、多少業務の流れなどイメージがつくような内容にできればと考えています。
ご指摘などありましたらコメントなどで教えていただけますと幸いです。
githubのリポジトリ及び該当ファイルは下記になります。
https://github.com/koichini/JupyterProject/blob/main/game_analytics_worlds2019/first_verification.ipynb
主な環境
- Python 3.8.5
- Pandas 1.2.0
- sckit-klearn 0.23.2
データ読み込み
Excelデータをデータフレームに格納
import pandas as pd
import numpy as np
import matplotlib.pyplot as plt

df = pd.read_excel("./2019-summer-match-data-OraclesElixir-2019-11-10.xlsx")
データの読み込みからはじめていきます。
今回のデータはeスポーツタイトル「League of Legends」の世界大会Worlds2019の試合データがkaggleにありましたので、そちらを拝借します。[参考]
こちらのデータはわたしもドメイン知識としては多少あり、データ分析の助けになると思い採用しています。
ゲームジャンルとしてはmobaと呼ばれ、戦略性も高く要求されるなかなかに複雑なゲームとなっています。
最初は特徴量の選択などは事前のわたしの持っている知識を利用していたのですが、そもそもその知識での判断に少し疑いを持ったところから本記事の手法を調べることに至ります。
また学習モデルの目的としては各選手のスタッツより、試合の勝敗を予測するものとします。
データの内容確認
df.head()

大会での各試合のプレイヤーの成績、チームの成績などが記録されています。
print(type(df))
df.shape

# 出力
<class 'pandas.core.frame.DataFrame'>
(1428, 98)
98の特徴量があります。
戦略性が求められることもあり、スタッツの記録内容も多いですね。
playeridが3桁の列を削除
# playerIDが三桁はチーム合計のスタッツになるため除外

dropPlayer = df[ df['playerid'] >= 100 ].index
df.drop(dropPlayer, inplace=True)
df['playerid'].unique()
データをみるとplayerIDが三桁のものはチームの合計スタッツになります。
その部分を抽出してチームの色、力関係など調べるのも面白そうですが今回は削除します。
単変量統計
単変量統計前準備
# 単変量統計前準備: DataFrameよりdtype=objectを削除

df = df.select_dtypes(include=['int64', 'float64'])
df.head()
少し雑なデータ削除になりますが、タイトルが目的なのでとりあえずです。
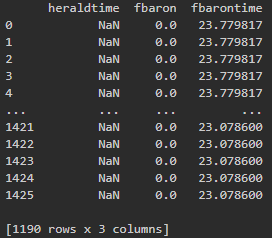
欠損値の抽出
print(df.loc[:, df.isnull().any()])

こちらで欠損値の確認を行いました。
欠損値のある各特徴量を確認し、それぞれ処理していきます。
欠損値の処理
# hereldtimeはチーム合計のスタッツとして記録されているため除外
df_dropH = df.drop(["heraldtime"], axis=1)

# fbaron, fbarontimeが欠損値のマッチは例外として除外
df_cleaning = df_dropH.dropna(how="any")

# 欠損値の確認
df_cleaning.isnull().any(axis=0)
コメントにも記載しましたが、欠損値を確認したところ"heraldtime"はチームの合計スタッツとして記録されているようでしたので、個人のスタッツを扱う今回は特徴量自体を削除しました。
"fbaron"および"fbarontime"が欠損値のあるものはゲームの終了がはやく記録されていないもののようでしたので、該当のマッチの選手スタッツの行を削除しました。
説明変数と目的変数の分割
data = df_cleaning.drop(['result', 'gameid'], axis=1)
target = df_cleaning['result']
今回はスタッツを参照にしつつ試合結果を予測するものとしてデータを分割します。
※"gameid"は明らかに影響してほしくはないため、事前に削除しています。
単変量統計の適用
# 単変量統計
from sklearn.feature_selection import SelectPercentile
from sklearn.model_selection import train_test_split

X_train, X_test, y_train, y_test = train_test_split(
    data, target, random_state=0, test_size=.5)

# SelectPercentileを使用して特徴量を半分に
select = SelectPercentile(percentile=50)
select.fit(X_train, y_train)
# 訓練セットを変換
X_train_selected = select.transform(X_train)

print("X_train.shape: {}".format(X_train.shape))
print("X_train_selected.shape: {}".format(X_train_selected.shape))
今回は自動特徴量選択として単変量統計を採用しています。
scikit-learnのSelectPercentileを読み込みpercentileで50%の特徴量に絞る設定を行いデータセットに適用しています。
出力結果は下記です。
# 出力結果
X_train.shape: (575, 72)
X_train_selected.shape: (575, 36)
特徴量が半分になっていますね!
どのような特徴量の選択をしているか確認してみます。
# 選択特徴量の可視化
mask = select.get_support()
print(mask)

plt.matshow(mask.reshape(1, -1), cmap='gray_r')
plt.xlabel('Sample index')

get_support関数を使用してどのような特徴量選択をしているか確認を行いました。
採用している特徴量を見ると、わたし目線ではなかなか不自然な箇所がなく自動特徴量選択は参考として有用な気がします。
テストデータへの変換及び効果の確認
from sklearn.linear_model import LogisticRegression

# テストデータの変換
X_test_selected = select.transform(X_test)

lr = LogisticRegression()
lr.fit(X_train, y_train)
print("Score with all features: {:.3f}".format(lr.score(X_test, y_test)))
lr.fit(X_train_selected, y_train)
print("Score with only selected features: {:.3f}".format(lr.score(X_test_selected, y_test)))
# 出力
Score with all features: 0.800
Score with only selected features: 0.918
スコアも上がっているため、ある程度の効果が出ていることが確認できます。
こちらの特徴量を使用してグリッドサーチ、ランダムサーチを行ってモデルの選定もしていきます。
グリッドサーチとランダムサーチ
import scipy.stats
from sklearn.linear_model import LogisticRegression
from sklearn.svm import LinearSVC
from sklearn.svm import SVC
from sklearn.tree import DecisionTreeClassifier
from sklearn.ensemble import RandomForestClassifier
from sklearn.neighbors import KNeighborsClassifier
from sklearn.model_selection import GridSearchCV
from sklearn.model_selection import RandomizedSearchCV
from sklearn.metrics import f1_score


# グリッドサーチ用にモデルとパラメーターセットをまとめた辞書を用意
# 辞書のkeyにはオブジェクトのインスタンスを指定することができます
model_param_set_grid = {
    LogisticRegression(): {
        "C": [10 ** i for i in range(-5, 5)],
        "random_state": [42]
    },
    LinearSVC(): {
        "C": [10 ** i for i in range(-5, 5)],
        "multi_class": ["ovr", "crammer_singer"],
        "random_state": [42],
        "max_iter": [1000]
    },
    SVC(): {
        "kernel": ["linear", "poly", "rbf", "sigmoid"],
        "C": [10 ** i for i in range(-5, 5)],
        "decision_function_shape": ["ovr", "ovo"],
        "random_state": [42],
        "max_iter": [1000]
    },
    DecisionTreeClassifier(): {
        "max_depth": [i for i in range(1, 20)],
    },
    RandomForestClassifier(): {
        "n_estimators": [i for i in range(10, 20)],
        "max_depth": [i for i in range(1, 10)],
    },
    KNeighborsClassifier(): {
        "n_neighbors": [i for i in range(1, 10)]
    }
}

# ランダムサーチ用にモデルとパラメーターセットをまとめた辞書を用意
model_param_set_random = {
    LogisticRegression(): {
        "C": scipy.stats.uniform(0.00001, 1000),
        "random_state": scipy.stats.randint(0, 100)
    },
    LinearSVC(): {
        "C": scipy.stats.uniform(0.00001, 1000),
        "multi_class": ["ovr", "crammer_singer"],
        "random_state": scipy.stats.randint(0, 100),
        "max_iter": [1000]
    },
    SVC(): {
        "kernel": ["linear", "poly", "rbf", "sigmoid"],
        "C": scipy.stats.uniform(0.00001, 1000),
        "decision_function_shape": ["ovr", "ovo"],
        "random_state": scipy.stats.randint(0, 100),
        "max_iter": [1000]
    },
    DecisionTreeClassifier(): {
        "max_depth": scipy.stats.randint(1, 20),
    },
    RandomForestClassifier(): {
        "n_estimators": scipy.stats.randint(10, 100),
        "max_depth": scipy.stats.randint(1, 20),
    },
    KNeighborsClassifier(): {
        "n_neighbors": scipy.stats.randint(1, 20)
    }
}

# スコア比較用に変数を用意
max_score = 0
best_model = None
best_param = None

# グリッドサーチでパラメーターサーチ
for model, param in model_param_set_grid.items():
    clf = GridSearchCV(model, param)
    clf.fit(X_train_selected, y_train)
    y_pred = clf.predict(X_test_selected)
    score = f1_score(y_test, y_pred, average="micro")
    # 最高評価更新時にモデルやパラメーターも更新
    if max_score < score:
        max_score = score
        best_model = model.__class__.__name__
        best_param = clf.best_params_

# ランダムサーチでパラメーターサーチ
for model, param in model_param_set_random.items():
    clf = RandomizedSearchCV(model, param)
    clf.fit(X_train_selected, y_train)
    y_pred = clf.predict(X_test_selected)
    score = f1_score(y_test, y_pred, average="micro")
    # 最高評価更新時にモデルやパラメーターも更新
    if max_score < score:
        max_score = score
        best_model = model.__class__.__name__
        best_param = clf.best_params_

print("学習モデル:{},\nパラメーター:{}".format(best_model, best_param))
print("ベストスコア:",max_score)
# 出力
学習モデル:DecisionTreeClassifier,
パラメーター:{'max_depth': 7}
ベストスコア: 1.0
グリッドサーチとランダムサーチを用いてモデル選定の参考にします。
それぞれのコードの解説は他記事など参考にしつつ、とりあえずコードを記載します。
ちょっとスコアが高すぎて過学習を起こしている懸念がありますので、最後に交差検証を行います。
交差検証
from sklearn.model_selection import cross_val_score, KFold

kfold = KFold(n_splits=8)

tree = DecisionTreeClassifier(max_depth=7, random_state=0)
tree.fit(X_train_selected, y_train)

scores = cross_val_score(tree, X_train_selected, y_train, cv=kfold)

print("cross-validation scores: {}".format(scores))
# 出力
cross-validation scores:
 [0.95833333 0.97222222 0.97222222 0.98611111 1.         1.
 0.98611111 0.95774648]
1に限りなく近いスコアがほとんどなので、懸念していた過学習の懸念も多少やわらぎました。
こちらのモデルでゲームの理解も深まる可能性を感じる内容になったように思います。
最後に
当初の目的としての特徴量の選択、モデルの選定など、多少機械的になりますがなかなか効果を実感できる結果になったと思います。
扱うドメインによって手法は色々ありそうですが、多少業務としての流れもイメージできた気がします。
早く現場で経験を積めるようになりますように。
ここまできまして、本記事は分割で投稿したほうが自分の記録のためにもいいような気がしてきました…。
とりあえずあとで考えることにします。
ここまで読んでいただき、ありがとうございました。