microshadesとは
色覚異常 (CVD) を持つ人に適したカラーパレットはいくつかあるが、多数の色を同時に表示するマイクロバイオームデータには不十分であることが多い。
R パッケージであるmicroshadesでは、CVDでアクセス可能なマイクロバイオーム図を作成することができる。
CVDフレンドリーなカラーパレットを出すだけではなく、マイクロバイオームデータを分類群ごとにlegend内で分けることが可能。
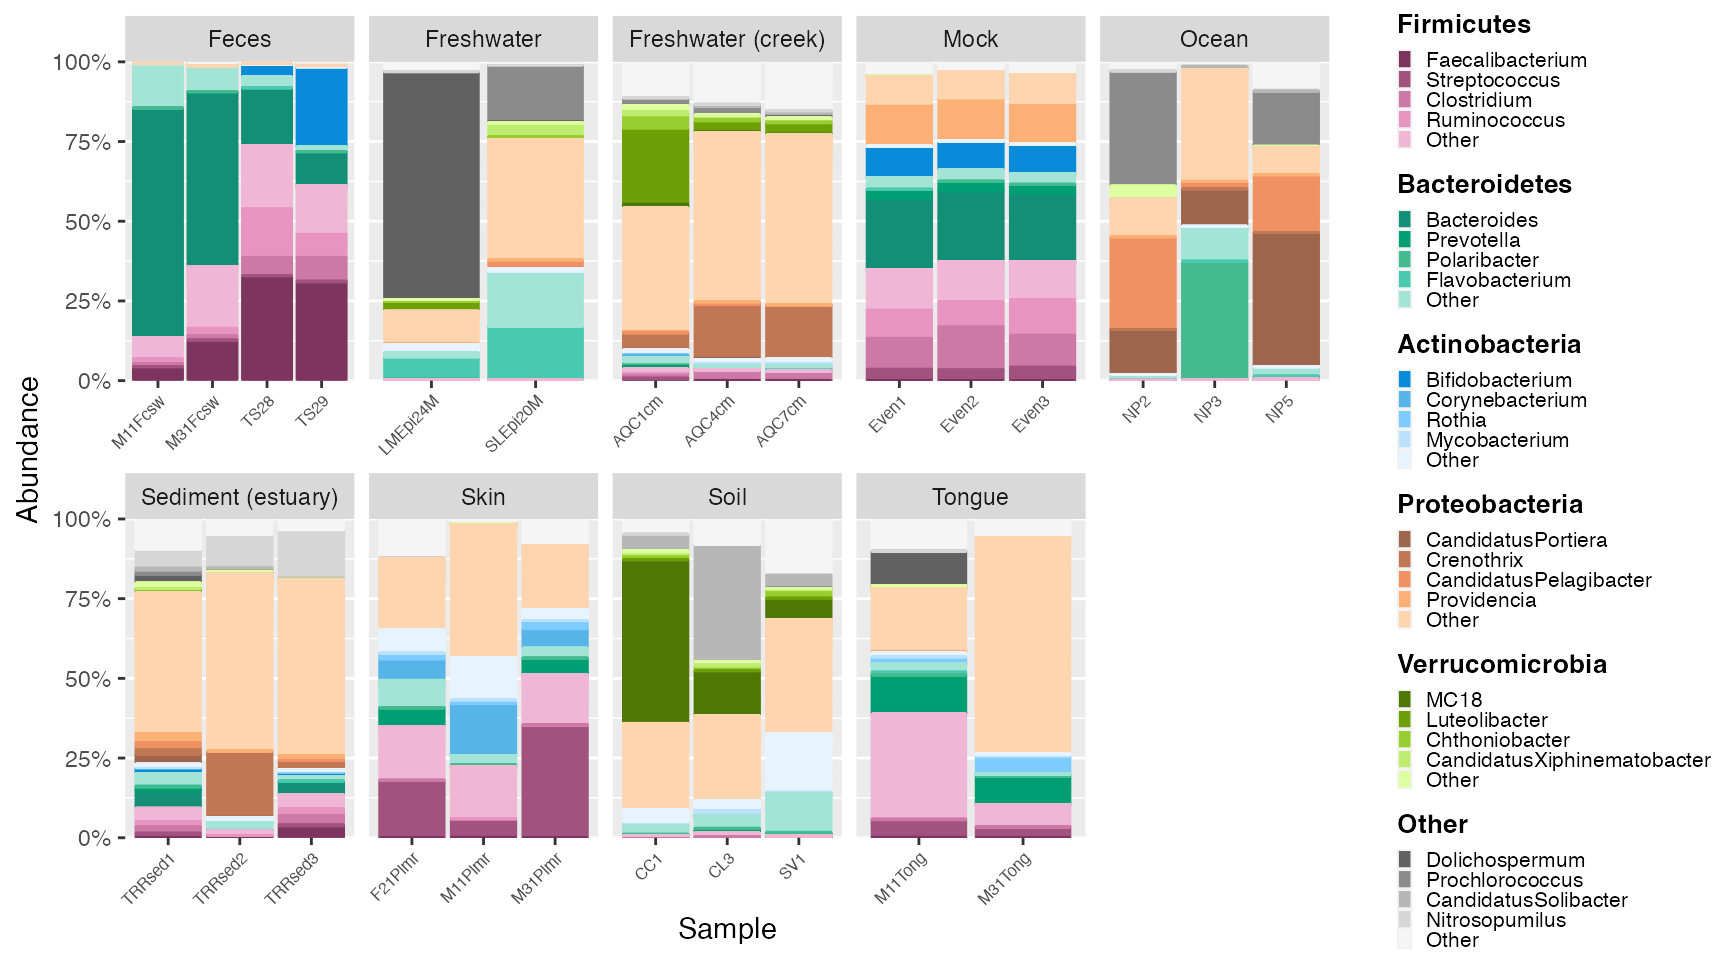
下記のように、Phylumごとに細菌属を分けて、グラデーションで示すことができる。(画像元)
論文
microshades: An R Package for Improving Color Accessibility and Organization of Microbiome Data
GitHub
microshades
インストールとライブラリ読み込み
# install microshades
remotes::install_github("KarstensLab/microshades")

# install phyloseq and speedyseq
BiocManager::install("phyloseq")

# Import libraries
library(phyloseq)
library(speedyseq)
library(dplyr)
library(ggplot2)
library(microshades)
library(qiime2R)
library(cowplot)
データ入力と整形
selected_groupsに入れる細菌門は分類名の変更されている可能性があるため、
phyloseqの関数 tax_table(physeq) などで随時確認する。
group_level, subgroup_levelは適宜変更可能。こちらも tax_table(physeq)を見て表記揺れに注意する。
"PHYLUM", "Phylum", "phylum"など。phyloseqで読み込むと基本は"Phylum"になる。
top_n_subgroupsでsubgroupを何種類表示するか決められる。
# Import data
physeq <- qza_to_phyloseq(
		features="table.qza",
		taxonomy="taxonomy_SILVA.qza",
		metadata ="metadata.txt"
		)

# Use microshades function prep_mdf to agglomerate, normalize, and melt the phyloseq object
mdf_prep <- prep_mdf(physeq)

# Create a color object for the specified data
# Check tax_table(physeq)
color_obj_physeq <- create_color_dfs(
					mdf_prep, selected_groups = c("Firmicutes", "Bacteroidota", "Actinobacteriota", "Proteobacteria"),
					top_n_subgroups = 4,
					cvd = TRUE,
					top_orientation = TRUE
					)

# Extract
mdf_physeq <- color_obj_physeq$mdf
cdf_physeq <- color_obj_physeq$cdf
グラフの描画
凡例をPhylumごとに見出しと色分けをする場合は、custom_legend関数を用いる。
カスタムした凡例と棒グラフを組み合わせる場合は、plot_gridで組み合わせて表示する。
plot_1 <- plot_microshades(mdf_physeq, cdf_physeq, group_label = "Phylum  Genus")

plot_diff <- plot_1 +
	scale_y_continuous(labels = scales::percent, expand = expansion(0)) +
	theme(
		legend.position = "none",
		axis.title.y = element_text(face = "bold"),
		axis.title.x = element_text(face = "bold"),
		axis.text.y = element_text(face = "bold")
		)

# Custom legend
custom_legend <-custom_legend(mdf_physeq, cdf_physeq, legend_text_size = 12)

# Combine plot and legend
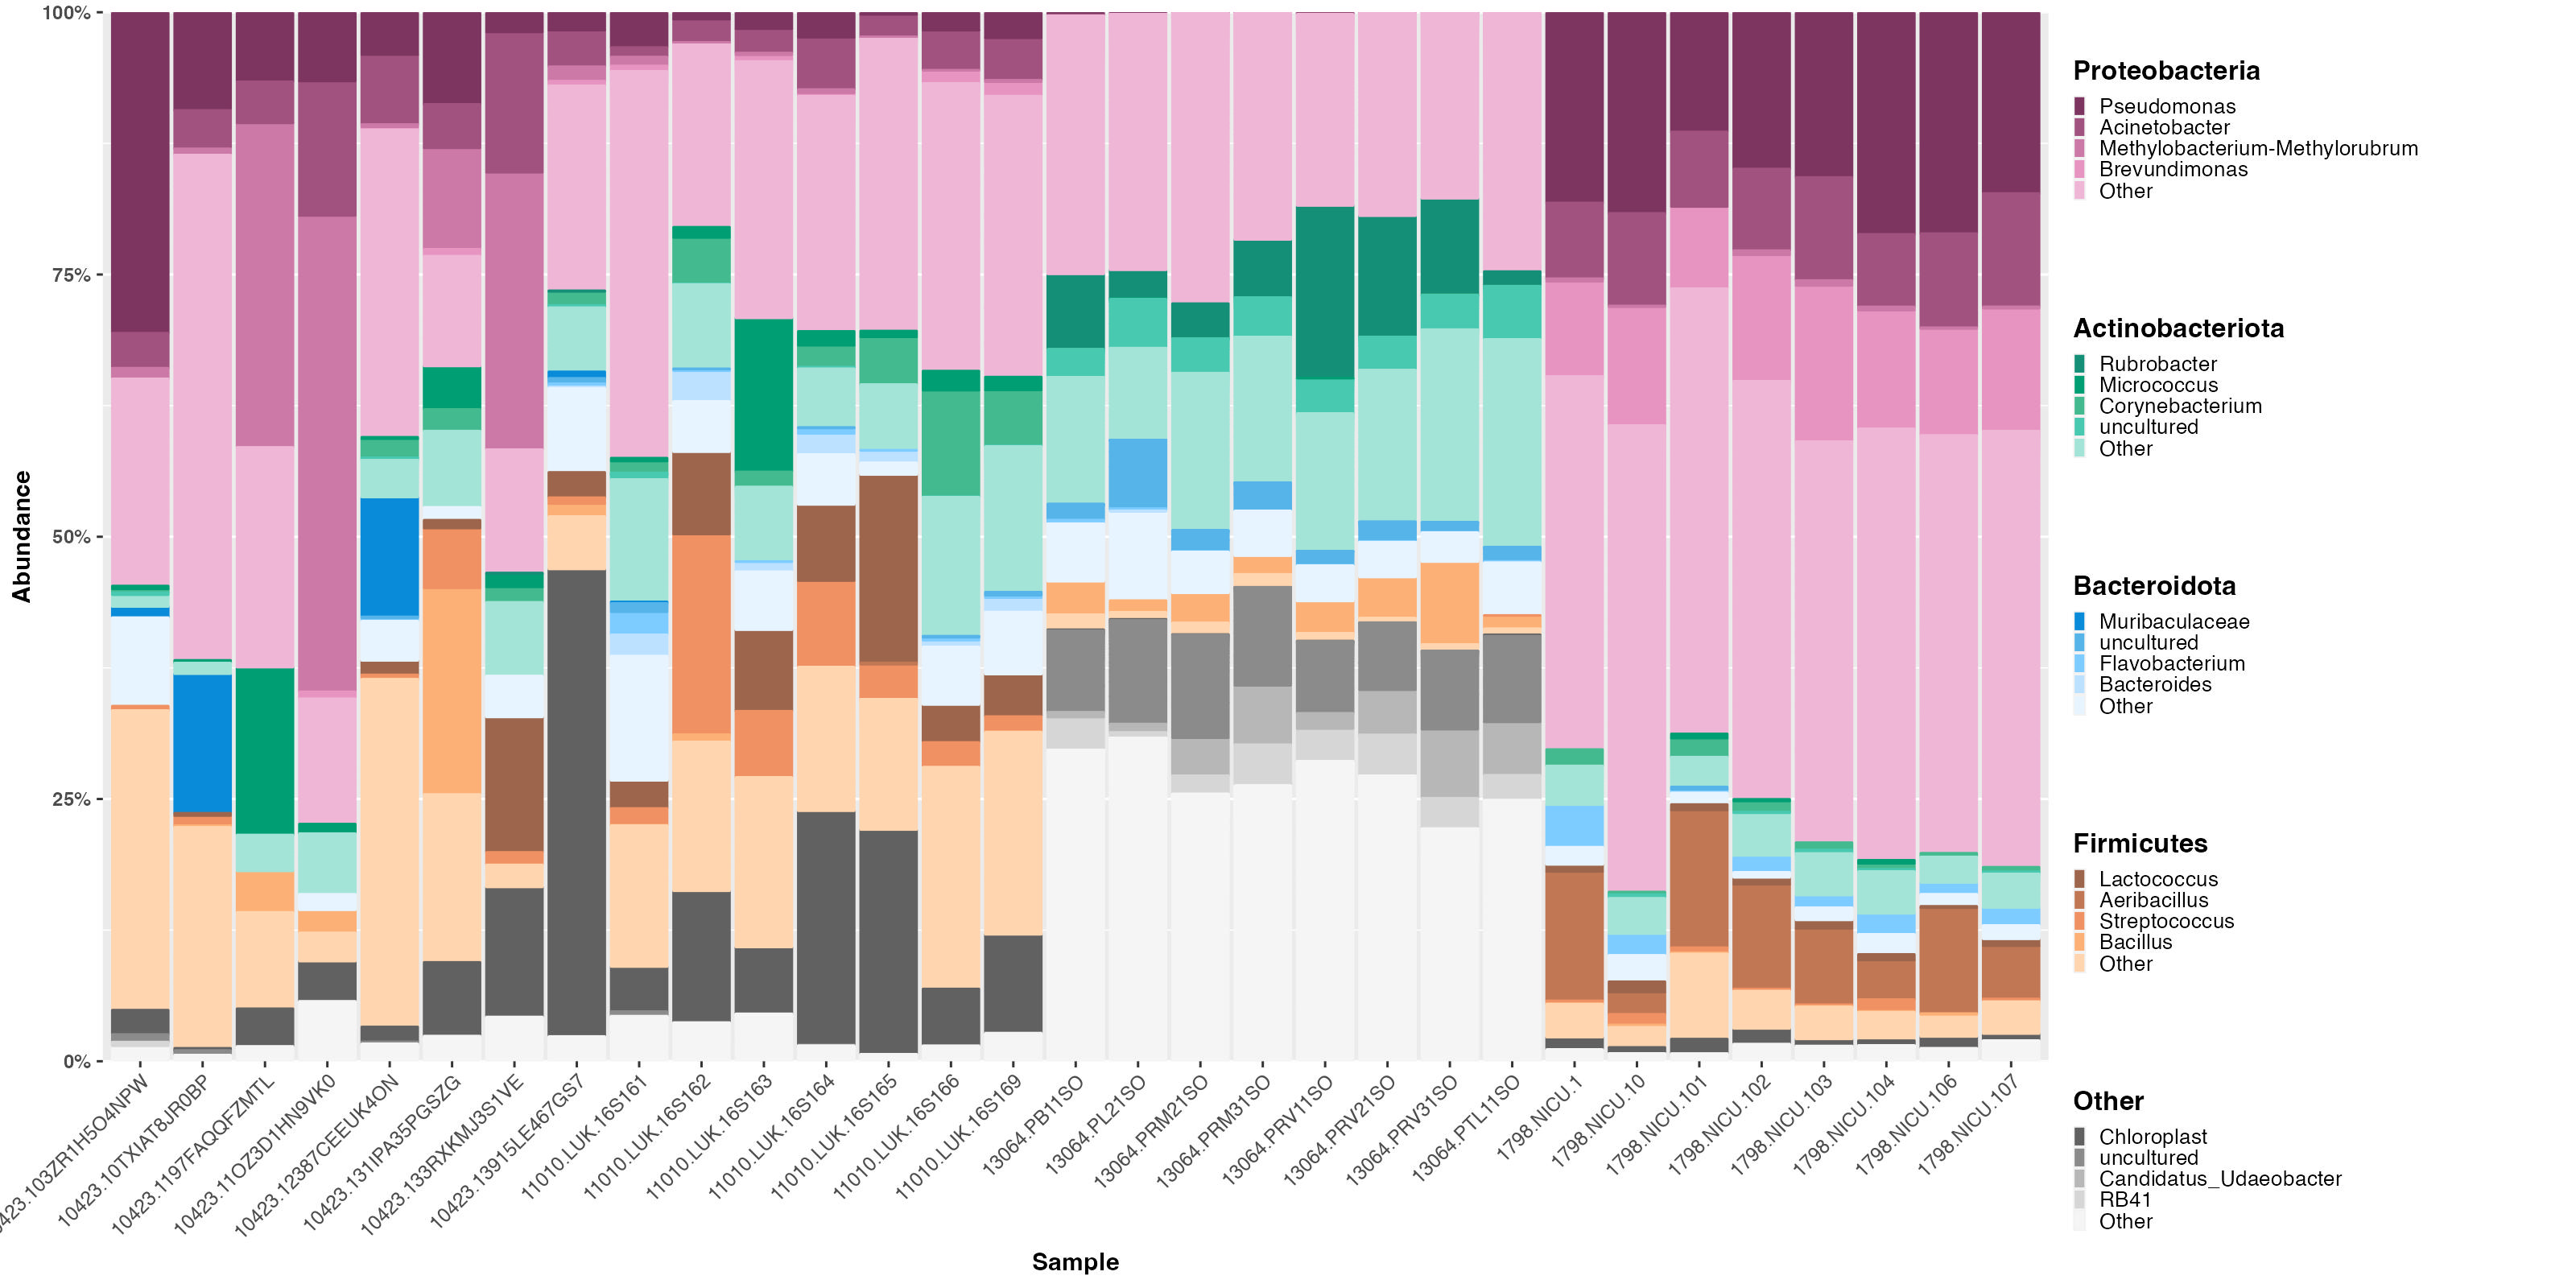
plot_grid(plot_diff, custom_legend, rel_widths = c(1, .25))

