pythonのmatplotlibで日本語を扱う
-
Qiitaにもいくつかおんなじような記事あるんですが、なんか分かりにくかったので自分の為にまとめておく
-
状況としては、macOS Sierra でmatplotlibのデフォルトのフォントが日本語対応しておらず、▫︎▫︎▫︎に(豆腐というらしい) とりあえず、グラフに日本語が表示されてほしい!
手順
-
http://ipafont.ipa.go.jp/old/ipafont/download.html に行って、TTFファイルの4書体パックをダウンロード
|font |name |family|
---|---|---|---|
|ipagp.ttf | IPAPGothic| [sans-serif]
|ipamp.ttf | IPAPMincho | [sans-serif]
|ipam.ttf | IPAMincho | [sans-serif]
|ipag.ttf | IPAGothic | [sans-serif]
な感じで対応しているみたい (http://qiita.com/kshigeru/items/0cfc0778bab197687967 を参照)なので、
plt.rcParams['font.family'] = 'IPAPGothic' #全体のフォントを設定
とする。ついでにグラフの大きさとか、縦軸、横軸のフォントサイズとかも設定しておこう:
plt.rcParams["figure.figsize"] = [20, 12] # グラフのサイズを指定
plt.rcParams['font.size'] = 20 #フォントサイズを設定 default : 12
plt.rcParams['xtick.labelsize'] = 15 # 横軸のフォントサイズ
plt.rcParams['ytick.labelsize'] = 15 # 縦軸のフォントサイズ
3.
~/.matplotlib/fontList.py3k.cacheがフォントのキャッシュファイルみたいなので、rm -f ~/.matplotlib/fontList.py3k.cacheとしたうえで、(Jupyter notebook上で)Runすると、
%matplotlib inline
import matplotlib.pyplot as plt

plt.rcParams['font.family'] = 'IPAPGothic' #全体のフォントを設定

plt.rcParams["figure.figsize"] = [20, 12]
plt.rcParams['font.size'] = 20 #フォントサイズを設定 default : 12
plt.rcParams['xtick.labelsize'] = 15 # 横軸のフォントサイズ
plt.rcParams['ytick.labelsize'] = 15

# test
df = DataFrame(np.arange(0, 12).reshape(6, -1), columns = ['始め','終わり'])
df.plot(kind = 'bar', x = '始め', y = '終わり').set(xlabel = '始め', ylabel = '終わり')
# plt.show()  # %matplotlib inlineを指定しているため、あってもなくても良い
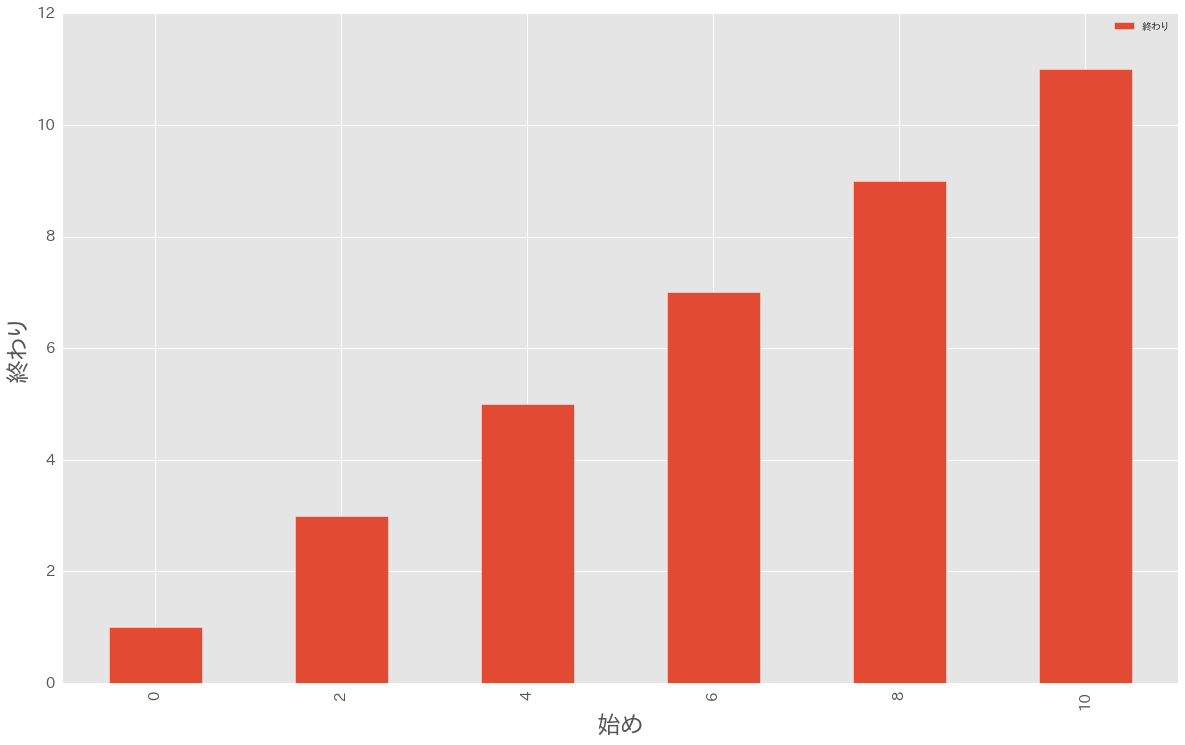
じゃーん!