時系列データでグループ毎にリサンプリングして欠損行の補間を行う処理に困ったので共有
例えば、こんな店舗別の売上データがあったとして、
shop	date	sales
A	2020-01-01	100
A	2020-01-04	200
B	2020-01-02	300
B	2020-01-03	400
C	2020-01-02	500
C	2020-01-04	600
各店舗で売上が無かった日は売上0として行を補完したいとする。
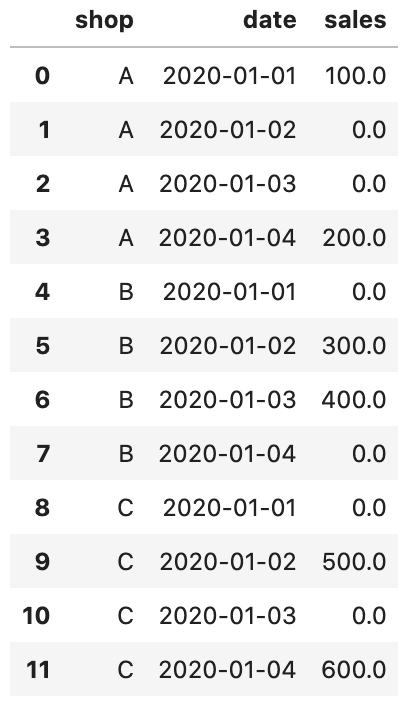
最終的に手に入れたいデータとしては↓のイメージ
shop	date	sales
A	2020-01-01	100.0
A	2020-01-02	0.0
A	2020-01-03	0.0
A	2020-01-04	200.0
B	2020-01-01	0.0
B	2020-01-02	300.0
B	2020-01-03	400.0
B	2020-01-04	0.0
C	2020-01-01	0.0
C	2020-01-02	500.0
C	2020-01-03	0.0
C	2020-01-04	600.0
日付インデックスをグループ間で粒度を揃え、同じグラフ内で可視化したい場合や、
グループを跨って日付単位で集計したい場合などには、このような粒度でデータを揃えたいときありますよね。
グループによっては間の日付が歯抜けしていたり、期間の始まりと終わりが一致していない、
なんて言う時に綺麗にデータを整えることができるので是非紹介したい方法になります!
説明にあたり、まずはサンプルデータを準備します。
# データ準備
sample = pd.DataFrame({
    "shop": ["A", "A", "B", "B", "C", "C"],
    "date": pd.to_datetime(["2020-1-1", "2020-1-4", "2020-1-2", "2020-1-3", "2020-1-2", "2020-1-4"]),
    "sales": [100, 200, 300, 400, 500, 600],
})
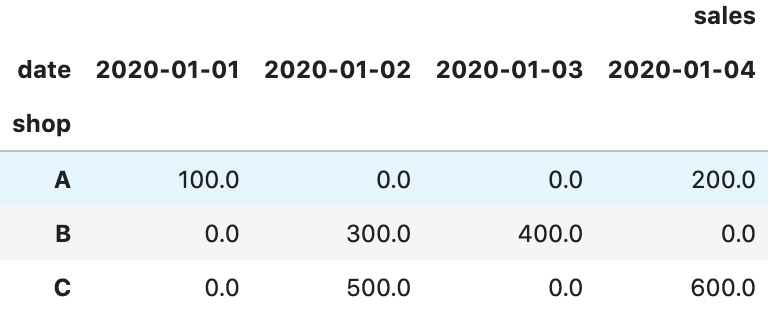
pd.pivot_tableでまずは横展開し、fillnaメソッドでNan値に0を代入
data = pd.pivot_table(sample, index="shop", columns="date").fillna(0)
stackメソッドで再度、縦に展開
data = data.stack().reset_index()
data
できた!!
CROSS JOINをつかって日付とグループの組み合わせテーブルをわざわざ作成する必要がないので、少ないコード量で実現できて楽チンですね!

