はじめに
振動データを機械学習モデルで分類するタスクを行う上で、周波数スペクトルの統計量を特徴量として利用したいことがありました。
しかし、自分が普段利用しているPythonではそのようなライブラリがなかったため、Rのseewaveというパッケージを利用して算出したので、その流れを紹介します。
結論
Rパッケージseewaveの中のspecpropという関数を利用することで、こちらのような統計量を算出できます。
seewaveをインストールする
install.packages("seewave", dependencies = TRUE)
上記のコマンドでインストールできます。
スペクトルを求める
library(seewave)

data = read.table('data.txt')
data_spec = spec(wave=data, f=2048)
data.txtに振動データが保存されているとします。
振動データのスペクトルはseewaveパッケージのspecという関数を利用することで求められます。
spec関数の詳細はこちらをご覧ください。
必須引数は、waveとfで、waveにはデータを入力して、fには、サンプリング周波数を入力します。
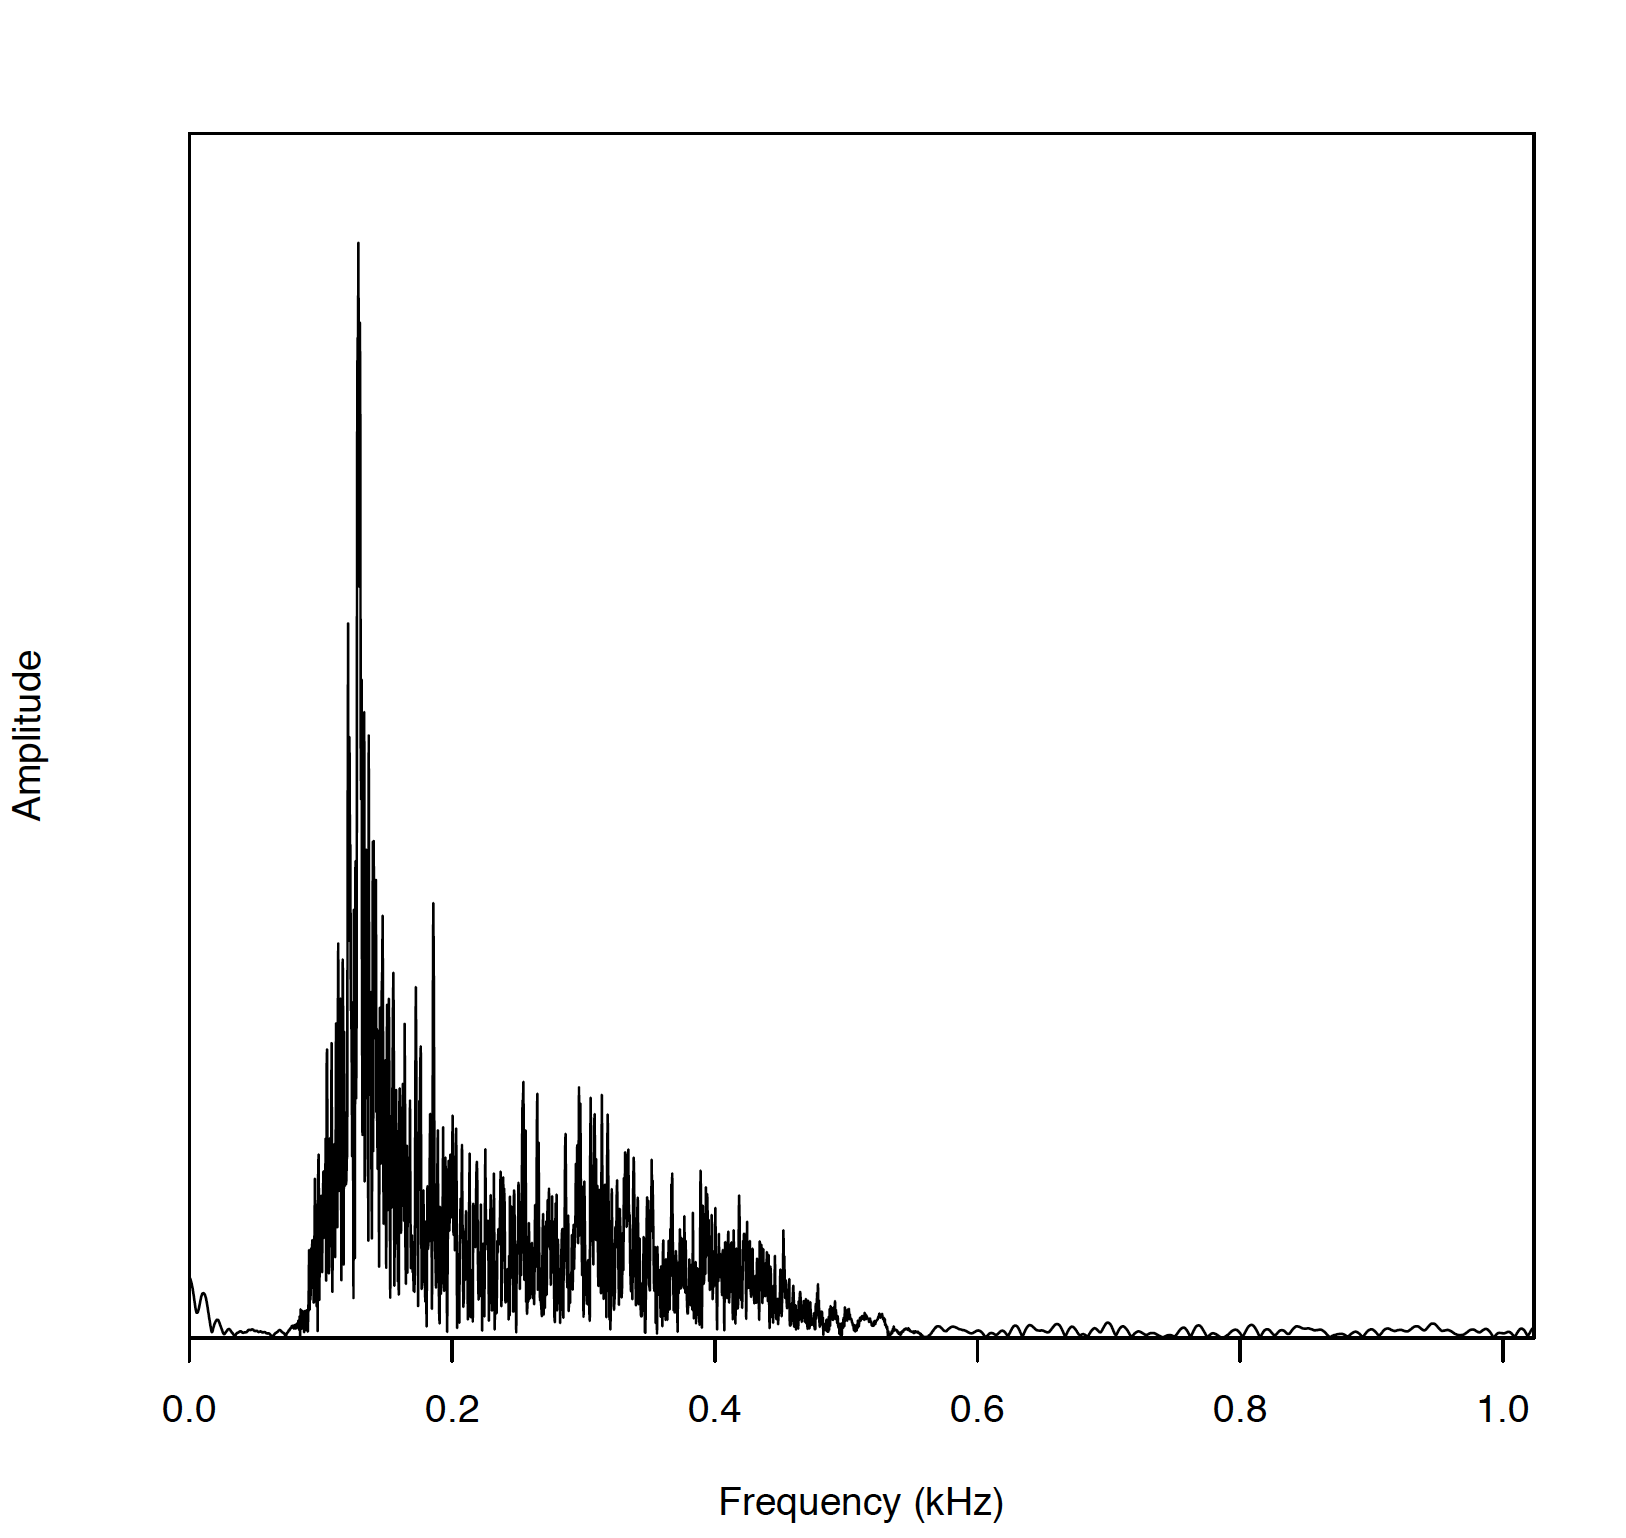
ここまでで、以下のように振動データのスペクトルを得られます。
 振動データ(data)
 振動データの周波数スペクトル(data_spec)
スペクトルの統計量を求める
specprop(data_spec)
最後に関数specpropを利用して、スペクトルの統計量を求めます。
下記のように、統計量を項目ごとに求めてくれます。
$mean
[1] 242.0646

$sd
[1] 130.2206

$median
[1] 211.0143

$sem
[1] 2.377493

$mode
[1] 129.067

$Q25
[1] 138.2861

$Q75
[1] 319.5945

$IQR
[1] 181.3084

$cent
[1] 242.0646

$skewness
[1] 4.525991

$kurtosis
[1] 37.61237

$sfm
[1] 0.2065057

$sh
[1] 0.8636798

$prec
        x
0.3413333