はじめに
角度の平均を単純に計算してはいけない
突然ですが、以下の角度値の平均を求める方法をご存知でしょうか?
$$
\lbrace10^\circ, 30^\circ, 350^\circ\rbrace
$$
これが普通の数値データであれば、$(10 + 30 + 350) / 3 = 130$のように平均が求まります。
しかし、角度の場合は平均10°となります。図示してみると、確かに10°を中心に分布しています。
なぜ単純計算では求まらないのでしょうか?
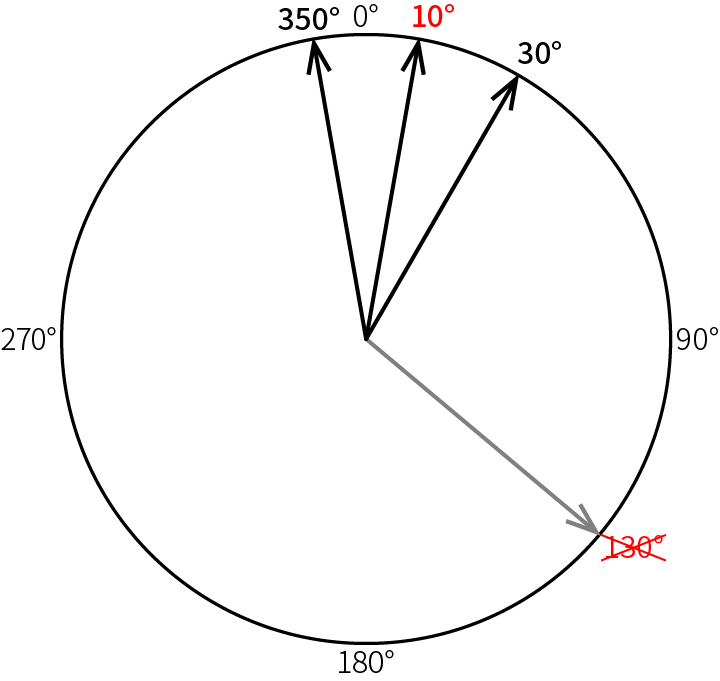
これには角度の周期性が関係しています。350°は数値上大きく見えますが、実際には0°に近い角度です。本来連続して続いているものを1周期で切断しているため、角度に対して素朴な統計処理をすることはできないのです。
角度データを扱う統計の分野を「角度統計(Circular Statistics, Directional Statistics)」といいます。日本ではあまりメジャーでないようで、書籍も英語のものがほとんどです。とはいえ、以下の記事やPDF資料を参照することで概要はつかめることでしょう。
- 角度の平均 角度の分散について - 中田 亨 (産業技術総合研究所)
- 角度データの統計処理基礎 - 2012/1/7 第4回 定量生物学䛾会 チュートリアル
- NCSS Statistical Software - Circular Data Analysis
角度の統計計算に複素数を使う
「角度データの統計処理基礎」のp.5にも出ているとおり、角度の平均はそれぞれの角度を取る単位ベクトルを足し合わせたベクトルの角度です。
角度データの集合を$\lbrace\theta_j\mid j=0,1,2,...,N\rbrace$として、$\cos\theta_j, \sin\theta_j$の総和をそれぞれとれば、足し合わせたベクトルが求まります。
$$
\left( \sum_j\cos\theta_j, \sum_j\sin\theta_j \right)
$$
複素数平面の考えを用いると、この計算はもっと楽に書けます。
オイラーの公式$e^{i\theta}=\cos\theta + i\sin\theta$より、合計したベクトルは$\sum_j e^{ i\theta_j}$で表せます。この偏角が求めたい平均値なので、以下のようにシンプルな式で角度の平均を求めることができます。
$$\rm{mean}(\lbrace\theta_j\mid j=0,1,2,...,N\rbrace) = \arg\left(\sum_j e^{i\theta_j}\right)$$
本記事の内容と実装したコード
本記事では、複素数を使う方法で、角度における基本的な統計量を算出します。
Rには既にcircularやCircStatsのような高機能な角度統計ライブラリが存在するため、本記事ではPythonを使って実装することにします。
実装したコードの全体は以下のGistからご覧いただけます。モジュールとしてimportして使うことも可能です。
準備
以下のパッケージ・モジュールを使用します。cmathは複素数の計算をするために必要です。
基本的な数学関数はnumpyに実装されているものを使用します。
import cmath
import numpy as np
import scipy.stats as stats
平均
冒頭で述べた通り、偏角が$\theta_j$である複素数の総和をとり、偏角を求めます。データの単位が違うと大変なので、度であるかラジアンであるかを引数degで受け取るようにしています。単位が度の場合は最初にnp.deg2radでラジアンに統一し、返す際にnp.rad2degで度に戻します。
def mean(angles, deg=True):
    '''Circular mean of angle data(default to degree)
    '''
    a = np.deg2rad(angles) if deg else np.array(angles)
    angles_complex = np.frompyfunc(cmath.exp, 1, 1)(a * 1j)
    mean = cmath.phase(angles_complex.sum()) % (2 * np.pi)
    return round(np.rad2deg(mean) if deg else mean, 7)
Pythonではjをつけて虚数を表す点にご注意ください。また、cmath.phaseは結果を[-π, π]の範囲で返すため、2πで割った余りを計算することで0から2πに直しました。
分散
以下のように$R$という数値を定めます。絶対値1である複素数の総和をデータ数$N$で割っているので、$0 \leq R \leq 1$です。
$$R = \rm{abs}\left(\frac{1}{N}\sum _ { j } e ^ { i \theta _ { j } }\right)$$
分散$V=1-R$です。$V$が大きい($=R$が小さい)ほど、データが様々な方向にばらついているといえます。
def var(angles, deg=True):
    '''Circular variance of angle data(default to degree)

    0 <= var <= 1
    '''
    a = np.deg2rad(angles) if deg else np.array(angles)
    angles_complex = np.frompyfunc(cmath.exp, 1, 1)(a * 1j)
    r =abs(angles_complex.sum()) / len(angles)
    return round(1 - r, 7)
標準偏差
標準偏差$S = \sqrt{-2 \ln R}$です。突然logが出てきましたが、定義がこのようになっています1。
Google検索などでプロットを見てみると分かる通り、$R$が小さいほど大きくなり、$R=0$で無限大に発散します。
明確な文献は見つけられていませんが、単位はラジアンと考えて良いようです2。
def std(angles, deg=True):
    '''Circular standard deviation of angle data(default to degree)

    0 <= std
    '''
    a = np.deg2rad(angles) if deg else np.array(angles)
    angles_complex = np.frompyfunc(cmath.exp, 1, 1)(a * 1j)
    r = abs(angles_complex.sum()) / len(angles)
    std = np.sqrt(-2 * np.log(r))
    return round(np.rad2deg(std) if deg else std, 7)
相関係数
2つの角度データの相関係数を求めます。NCSSのスライドのp.12に式が載っているのでそのまま実装します。
相関が有意であるかどうかの検定も可能です。実装にはRのcircularパッケージの該当部分を参考にしました。l20,l02,l22と相関係数$r$から検定統計量が求まり、検定統計量が標準正規分布に従うと仮定してp値を求めることができます。
def corrcoef(x, y, deg=True, test=False):
    '''Circular correlation coefficient of two angle data(default to degree)

    Set `test=True` to perform a significance test.
    '''
    convert = np.pi / 180.0 if deg else 1
    sx = np.frompyfunc(np.sin, 1, 1)((x - mean(x, deg)) * convert)
    sy = np.frompyfunc(np.sin, 1, 1)((y - mean(y, deg)) * convert)
    r = (sx * sy).sum() / np.sqrt((sx ** 2).sum() * (sy ** 2).sum())

    if test:
        l20, l02, l22 = (sx ** 2).sum(),(sy ** 2).sum(), ((sx ** 2) * (sy ** 2)).sum()
        test_stat = r * np.sqrt(l20 * l02 / l22)
        p_value = 2 * (1 - stats.norm.cdf(abs(test_stat)))
        return tuple(round(v, 7) for v in (r, test_stat, p_value))
    return round(r, 7)
様々な統計検定
角度統計では、検定も独自のものを使用します。冒頭で挙げた資料に検定も載っているものの、さすがに実装が重いため本記事では再実装しません。
もし必要になった場合は、Rに用意されている角度統計パッケージを使いましょう。PypeRというパッケージを使うと、Pythonからデータを渡してRに処理してもらうこともできます。
以下は、平均角度に関するパラメトリック検定であるWatson-Williams Testを使用している例です。
import pyper

r = pyper.R()
r('library(circular)')

r.assign('data1', [35, 45, 50, 55, 60, 70, 85, 95, 105, 120])
r.assign('data2', [75, 80, 90, 100, 110, 130, 135, 140, 150, 160, 165])
r('data1 <- circular(data1, units="degrees")')
r('data2 <- circular(data2, units="degrees")')

# Watson-Williams Test
print(r('watson.williams.test(list(data1, data2))'))
try({watson.williams.test(list(data1, data2))})

        Watson-Williams test for homogeneity of means

data:  1 and 2
F = 14.558, df1 = 1, df2 = 19, p-value = 0.001168
-
Kanti V Mardia and Peter E Jupp. Directional statistics, Vol. 494. John Wiley & Sons, Inc., 2000. ↩
-
circular statistics - How do I interpret the standard deviation of a directional dataset? ↩