はじめに
MATLAB Student Ambassador の K.M. です.
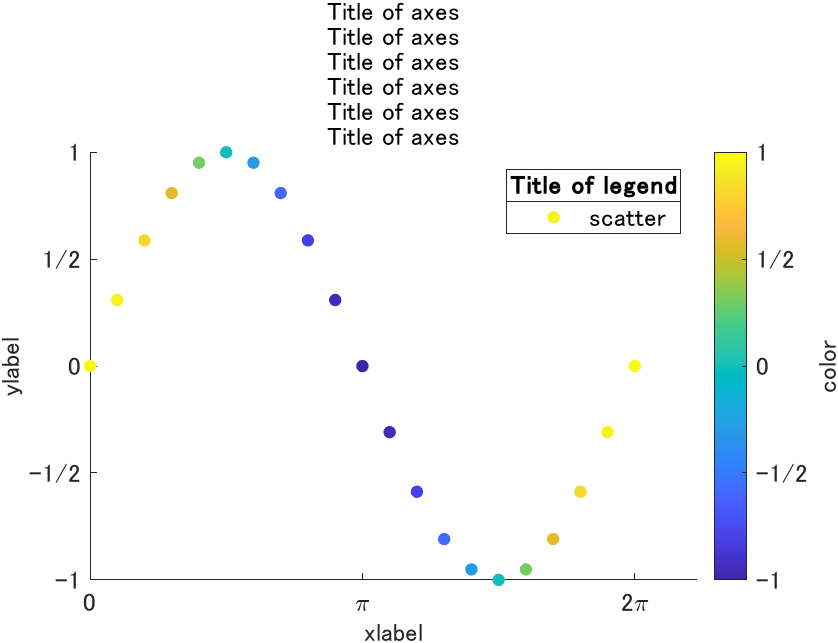
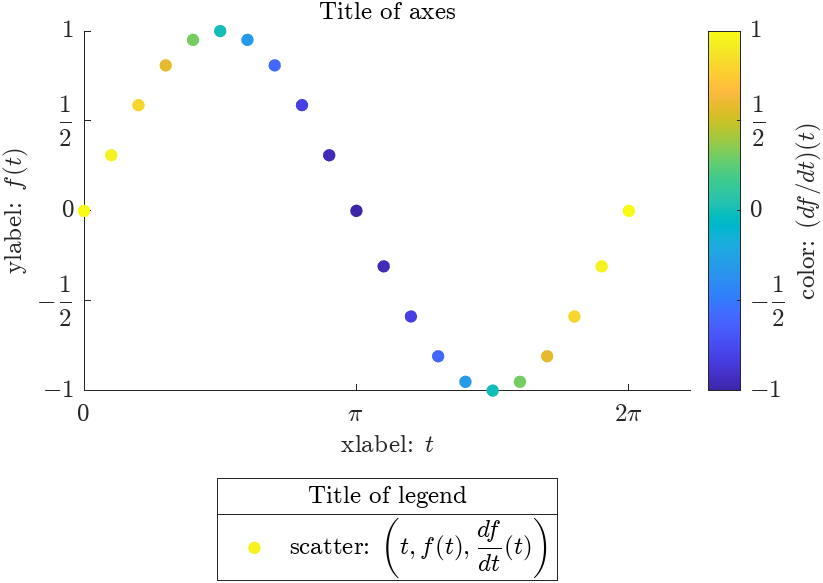
今回はグラフ中の文字たちを整える方法を紹介します.ゴールはこんなグラフです.
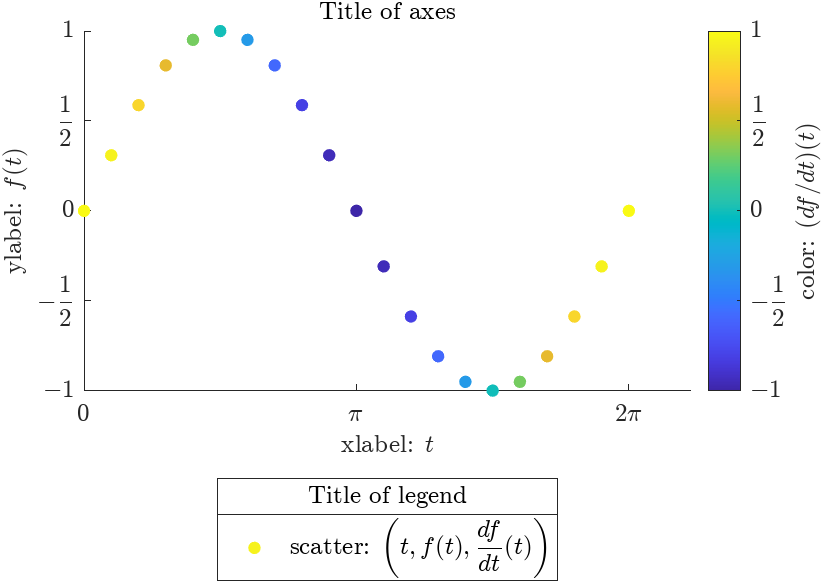
基本的な設定項目
まずは以下に示す基本的な設定項目を紹介します.
- 軸ラベル,カラーバーのラベル
- 軸目盛,カラーバーの目盛り
- タイトル
- 凡例
- フォントサイズの調整
下準備
適当なデータをプロットします.
x = linspace(0,2*pi,21);
y = sin(x);
c = cos(x);
scatter(x,y,[],c,"filled");
軸ラベルの設定
x,y 軸のラベルは xlabelやylabelで指定できます.カラーバーのラベルはLabel.Stringフィールドを書き換えることで指定できます.
xlabel("xlabel")
ylabel("ylabel")
cb              = colorbar;
cb.Label.String = "color";
軸目盛の設定
軸目盛の位置はxticksとyticksで,ラベルはxticklabelsとyticklabelsでそれぞれ指定します.カラーバーはフィールドを直接書き換えます.
xticks     ([0, pi, 2*pi])
xticklabels(["0","\pi","2\pi"])

yticks     ([-1 -0.5 0 0.5 1])
yticklabels(["-1","-1/2","0","1/2","1"])

cb.Ticks      = [-1 -0.5 0 0.5 1];
cb.TickLabels = ["-1","-1/2","0","1/2","1"];
タイトルと凡例
座標軸のタイトルを指定するにはtitle関数を使います.凡例にタイトルをつけるにはtitleのtargetとして凡例のハンドルを渡します.
title("Title of axes")
lgd = legend("scatter");
title(lgd,"Title of legend")
フォントサイズの調整
fontsize関数でフォントサイズを一括指定できます
fontsize(12,"points");
さらに見栄えを整える
もう少し頑張ってみます.
newline で改行
newlineを足すと改行できます.試しにタイトルを6行にしてみます.
title( ...
    "Title of axes"+newline+...
    "Title of axes"+newline+...
    "Title of axes"+newline+...
    "Title of axes"+newline+...
    "Title of axes"+newline+...
    "Title of axes"...
    );
interpreter の指定と数式の表示
ありとあらゆる interpreter を LaTeX に設定し,見栄えをよくします.数式も$$で囲むことでかっこよく書けます.
丁寧に Interpreter を設定するのは正直めんどくさいです.後述する「Interpreterの一括指定」のほうがよく使います
軸ラベル(colorbarは厄介)
xlabel("xlabel: $t$"   , Interpreter="latex")
ylabel("ylabel: $f(t)$", Interpreter="latex")

cb                   = colorbar;
cb.Label.String      = "color: $(df/dt)(t)$";
cb.Label.Interpreter = "latex";
軸目盛(set関数を使う)
xticks    ([0, pi, 2*pi])
xticklabels(["$0$","$\pi$","$2\pi$"])

yticks    ([-1 -0.5 0 0.5 1])
yticklabels(["$-1$","$\displaystyle-\frac{1}{2}$","$0$","$\displaystyle\frac{1}{2}$","$1$"])
set(gca,"tickLabelInterpreter","latex");

cb.Ticks = [-1 -0.5 0 0.5 1];
cb.TickLabels = ["$-1$","$\displaystyle-\frac{1}{2}$","$0$","$\displaystyle\frac{1}{2}$","$1$"];
cb.TickLabelInterpreter = "latex";
タイトルと凡例(素直)
title("Title of axes", Interpreter="latex")

lgd = legend("scatter: $\left(t,f(t),\displaystyle\frac{df}{dt}(t)\right)$", ...
             Interpreter="latex", ...
             Location="southoutside");
title(lgd,"Title of legend",Interpreter="latex")
interpreter の一括指定
以下のコマンドを実行しておくと,ほとんどの項目のinterpreterがlatexになってくれます.MATLABを再起動するとリセットされるので,その都度実行する必要があります.コードは MATLAB の 既定のプロパティを取り出して"Interpreter"という文字列を含むものをすべてLaTeXに変更するものです.
% MATLAB の 既定のプロパティを取得
defaults            = fieldnames(get(groot,"factory"));

% Interpreter 関連項目を抽出
interpreterSettings = defaults(contains(defaults,"Interpreter"));

% Default値をLaTeXに変更
for i = 1:numel(interpreterSettings)
    set(groot, replace(interpreterSettings{i},"factory","default"),"latex")
end
上記コマンドを実行後は, Interpreter の指定をほぼ省略できます.
colorbar の Label など,一部の項目の interpreter はデフォルト値を指定できないようです.それらの項目は手動で interpreter を指定する必要があります.
x = linspace(0,2*pi,21);
y = sin(x);
c = cos(x);
scatter(x,y,[],c,"filled");

xlabel("xlabel: $t$"   )
ylabel("ylabel: $f(t)$")

cb                   = colorbar;
cb.Label.String      = "color: $(df/dt)(t)$";

%%% ここだけ interpreter の指定が必要 %%%
cb.Label.Interpreter = "latex";

xticks     ([0, pi, 2*pi])
yticks     ([-1 -0.5 0 0.5 1])
cb.Ticks = [-1 -0.5 0 0.5 1];

xticklabels(["$0$","$\pi$","$2\pi$"])
yticklabels(["$-1$","$\displaystyle-\frac{1}{2}$","$0$","$\displaystyle\frac{1}{2}$","$1$"])
cb.TickLabels = ["$-1$","$\displaystyle-\frac{1}{2}$","$0$","$\displaystyle\frac{1}{2}$","$1$"];

title("Title of axes")

lgd = legend("scatter: $\left(t,f(t),\displaystyle\frac{df}{dt}(t)\right)$", ...
             Location="southoutside");
title(lgd,"Title of legend")

fontsize(12,"points");
元に戻すにはすべてをtexにします.
% MATLAB の 既定のプロパティを取得
defaults            = fieldnames(get(groot,"factory"));

% Interpreter 関連項目を抽出
interpreterSettings = defaults(contains(defaults,"Interpreter"));

% Default値をTeXに変更
for i = 1:numel(interpreterSettings)
    set(groot, replace(interpreterSettings{i},"factory","default"),"tex")
end
おまけ
アンダースコアの扱い
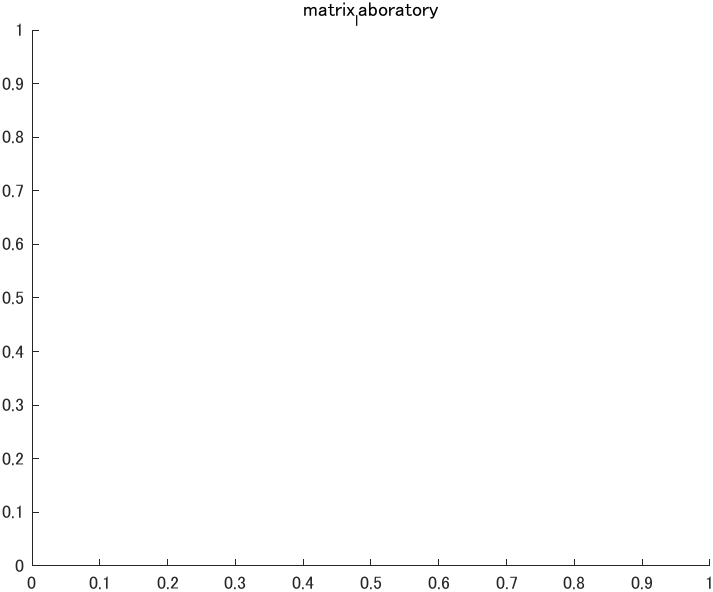
アンダースコア(_)が入っていると下付き添え字判定されてしまいます.
figure;
originalTitle = "matrix_laboratory";
title(originalTitle);
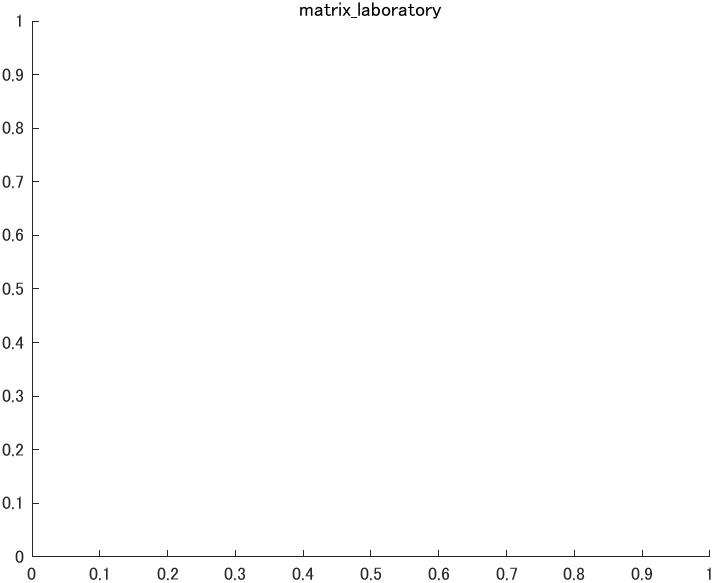
そんな時はアンダースコアの前に バックスラッシュ(\)を付ける必要があります.
私はよく replace関数で _を\_に置換しています.
originalTitle = "matrix_laboratory";
newTitle      = replace(originalTitle,"_","\_"); % "_" を "\_" に置換
title(newTitle);

