こんにちは。
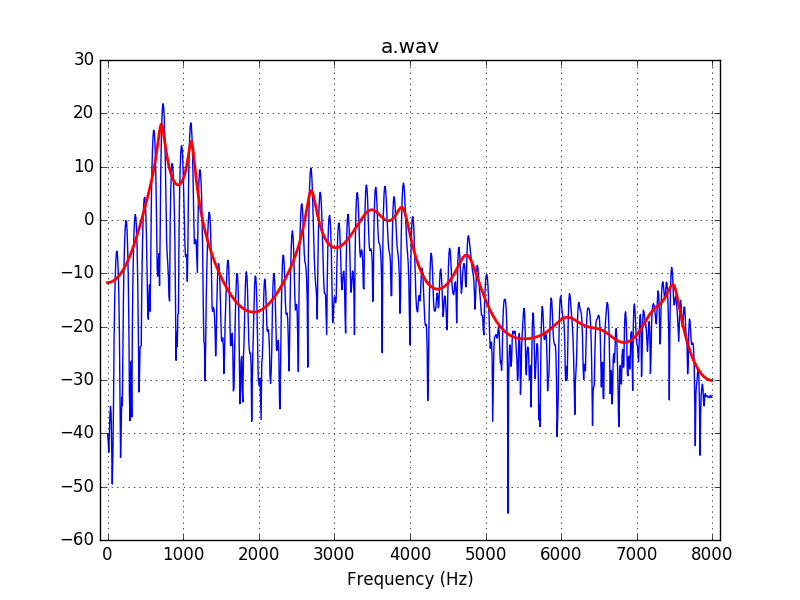
「線形予測分析(LPC)(Pythonで音声信号処理(2011/05/14)の第20回目:LPCスペクトル包絡を求める)」(= formant 分析)という記事を見つけたので、そこのコードをほぼそのまま動かしてみました。母音「あ」の例です。

走らせたコードは、そこに置いてあるそのままなのですが、書いておきます(levinson_durbin.py もそこから取ってきました):
- なお「Python(NumPy, SciPy)でフォルマント分析を行う」という記事でもこれを利用しているようです。
- 母音の音声ファイル a.wav もどこからか入手しました。
# coding:utf-8
from __future__ import division
import wave
import numpy as np
import scipy.io.wavfile
import scipy.signal
import pylab as P
from levinson_durbin import autocorr, LevinsonDurbin

"""LPCスペクトル包絡を求める"""

def wavread(filename):
    wf = wave.open(filename, "r")
    fs = wf.getframerate()
    x = wf.readframes(wf.getnframes())
    x = np.frombuffer(x, dtype="int16") / 32768.0  # (-1, 1)に正規化
    wf.close()
    return x, float(fs)

def preEmphasis(signal, p):
    """プリエンファシスフィルタ"""
    # 係数 (1.0, -p) のFIRフィルタを作成
    return scipy.signal.lfilter([1.0, -p], 1, signal)

def plot_signal(s, a, e, fs, lpcOrder, file):
    t = np.arange(0.0, len(s) / fs, 1/fs)
    # LPCで前向き予測した信号を求める
    predicted = np.copy(s)
    # 過去lpcOrder分から予測するので開始インデックスはlpcOrderから
    # それより前は予測せずにオリジナルの信号をコピーしている
    for i in range(lpcOrder, len(predicted)):
        predicted[i] = 0.0
        for j in range(1, lpcOrder):
            predicted[i] -= a[j] * s[i - j]
    # オリジナルの信号をプロット
    P.plot(t, s)
    # LPCで前向き予測した信号をプロット
    P.plot(t, predicted,"r",alpha=0.4)
    P.xlabel("Time (s)")
    P.xlim((-0.001, t[-1]+0.001))
    P.title(file)
    P.grid()
    P.show()
    return 0

def plot_spectrum(s, a, e, fs, file):
    # LPC係数の振幅スペクトルを求める
    nfft = 2048   # FFTのサンプル数
    fscale = np.fft.fftfreq(nfft, d = 1.0 / fs)[:nfft/2]
    # オリジナル信号の対数スペクトル
    spec = np.abs(np.fft.fft(s, nfft))
    logspec = 20 * np.log10(spec)
    P.plot(fscale, logspec[:nfft/2])
    # LPC対数スペクトル
    w, h = scipy.signal.freqz(np.sqrt(e), a, nfft, "whole")
    lpcspec = np.abs(h)
    loglpcspec = 20 * np.log10(lpcspec)
    P.plot(fscale, loglpcspec[:nfft/2], "r", linewidth=2)
    P.xlabel("Frequency (Hz)")
    P.xlim((-100, 8100))
    P.title(file)
    P.grid()
    P.show()
    return 0

def lpc_spectral_envelope(file):
    # 音声をロード
    wav, fs = wavread(file)
    t = np.arange(0.0, len(wav) / fs, 1/fs)
    # 音声波形の中心部分を切り出す
    center = len(wav) / 2  # 中心のサンプル番号
    cuttime = 0.04         # 切り出す長さ [s]
    s = wav[center - cuttime/2*fs : center + cuttime/2*fs]
    # プリエンファシスフィルタをかける
    p = 0.97         # プリエンファシス係数
    s = preEmphasis(s, p)
    # ハミング窓をかける
    hammingWindow = np.hamming(len(s))
    s = s * hammingWindow
    # LPC係数を求める
#    lpcOrder = 12
    lpcOrder = 32
    r = autocorr(s, lpcOrder + 1)
    a, e  = LevinsonDurbin(r, lpcOrder)
    plot_signal(s, a, e, fs, lpcOrder, file)
    plot_spectrum(s, a, e, fs, file)
    return 0

if __name__ == "__main__":
    file = "a.wav"
    lpc_spectral_envelope(file)
    exit(0)