この記事について
Pythonのデータ可視化ライブラリー、Altairの紹介です。日本語の情報が少ないので布教用に記事にします。英語に抵抗がない方は公式ページを見るのが一番わかりやすいと思います。
インストール
pipコマンドで簡単にインストールできます。vega_datasetsはこの後使うので一緒にインストールしましょう。
pip install altair vega_datasets
私はGoogle Colaboratoryを使いましたが、インストールなしで最初から使えました。
事前準備
以下でライブラリとデータセットを読み込んでください。
import altair as alt
from vega_datasets import data
iris = data.iris()
AltairはPandasとの連携が得意で、irisはPandasのDataFrameです。
基本的な可視化
以下はJupyterなどで直接可視化する想定のコードです。htmlで出力したい場合は末尾に.save("filename.html")を足してください。.interactive()はなくても大丈夫ですが、書くとグラフを動かせるようになります。この記事に貼るのは普通の画像なので、ぐりぐり動かしたい方はこちらでどうぞ。
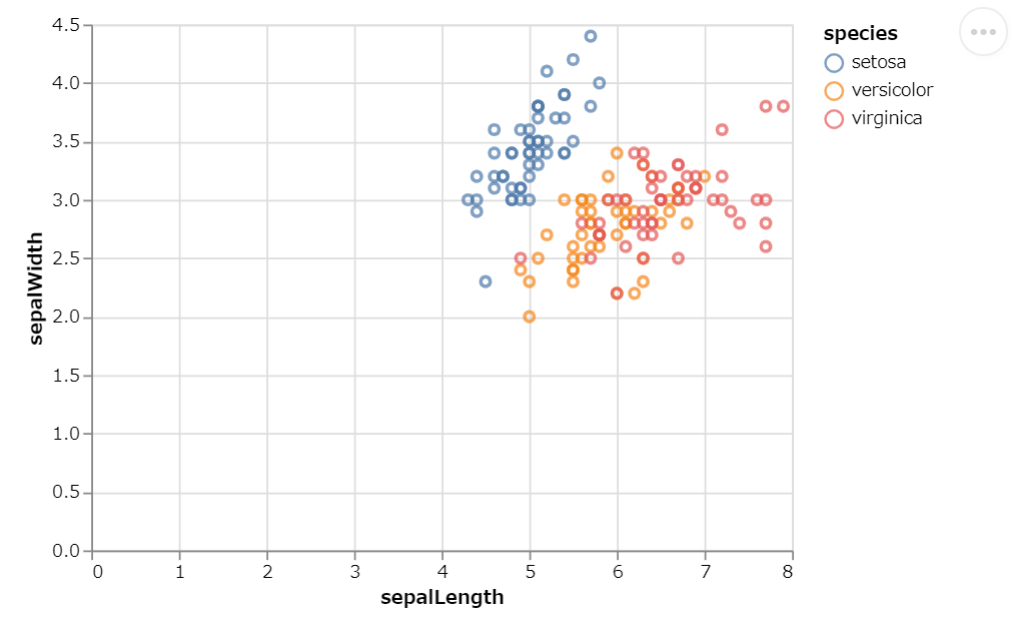
例①散布図
x軸とy軸の値を以下のように指定します。コメントのようなalt.X()という書き方もできて、複雑な可視化の際はこちらを使います。
alt.Chart(iris).mark_point().encode(
    x="sepalLength", # alt.X("sepalLength"),
    y="sepalWidth", # alt.Y("sepalWidth"),
    color="species"
).interactive()
例②棒グラフ
average()でspeciesごとに平均をとっているのがポイントです。平均以外にも様々な操作ができて、一覧はここで確認できます。
alt.Chart(iris).mark_bar().encode(
    x="average(sepalLength)", # alt.X("sepalLength", aggregate="average"),
    y="species", # alt.Y("species"),
).interactive()
要領はこんな感じです。make_xxxxxの部分をmake_lineとすれば折れ線グラフなんかも簡単に書けます。困ったときは公式ページのギャラリーから類似したグラフを探せば大体解決します。
TIPS(加筆するかも)
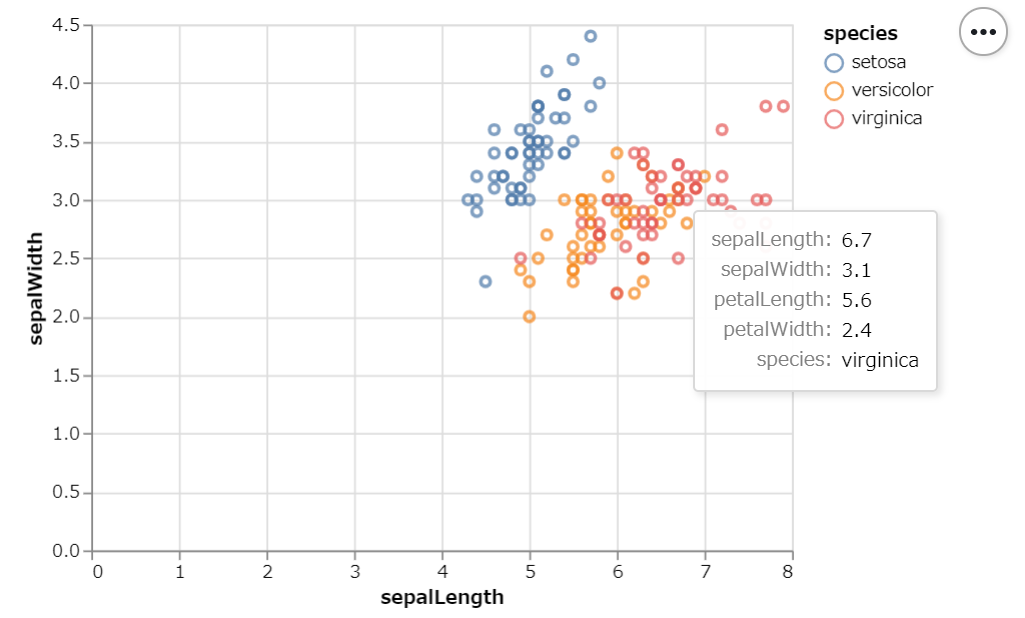
マウスオーバーで情報表示
tooltip引数で指定した情報がマウスオーバーで表示されます。
alt.Chart(iris).mark_point().encode(
    x="sepalLength",
    y="sepalWidth",
    color="species",
    tooltip=["sepalLength", "sepalWidth", "petalLength", "petalWidth", "species"]
).interactive()
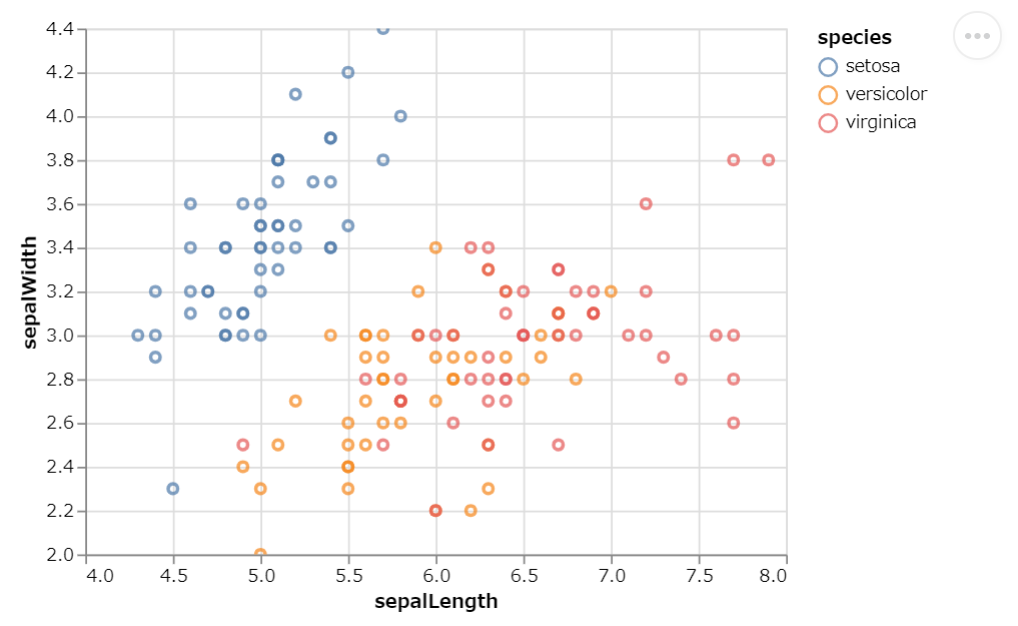
軸を0から書きたくない
量的なデータは基本的に0を含んで可視化されます。上のグラフは0を含まないようzero=Falseで明示しています。
alt.Chart(iris).mark_point().encode(
    alt.X("sepalLength", scale=alt.Scale(zero=False)),
    alt.Y("sepalWidth", scale=alt.Scale(zero=False)),
    color="species"
).interactive()
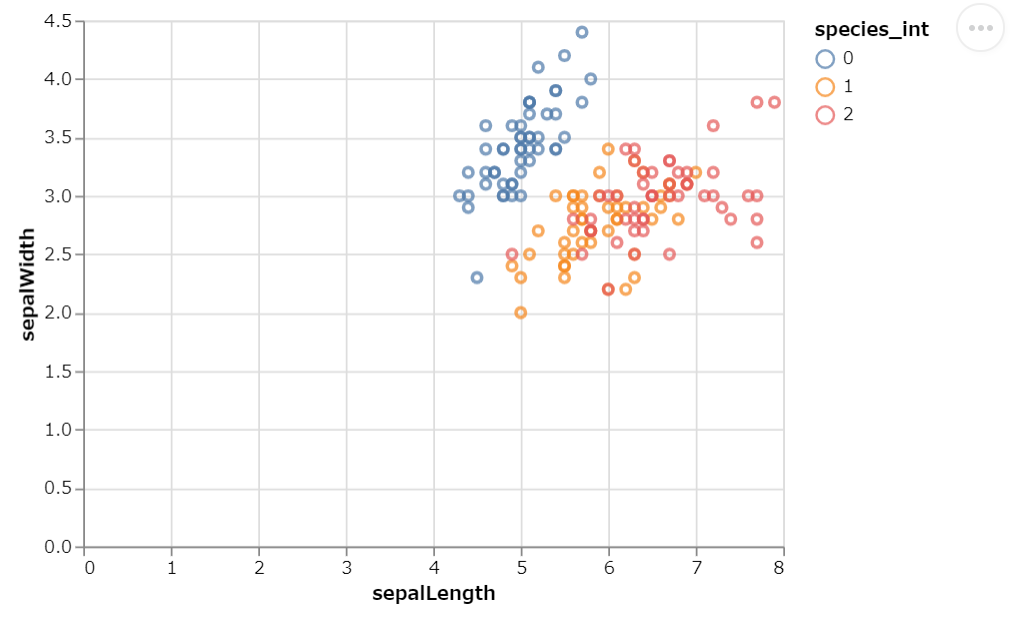
データ型の指定
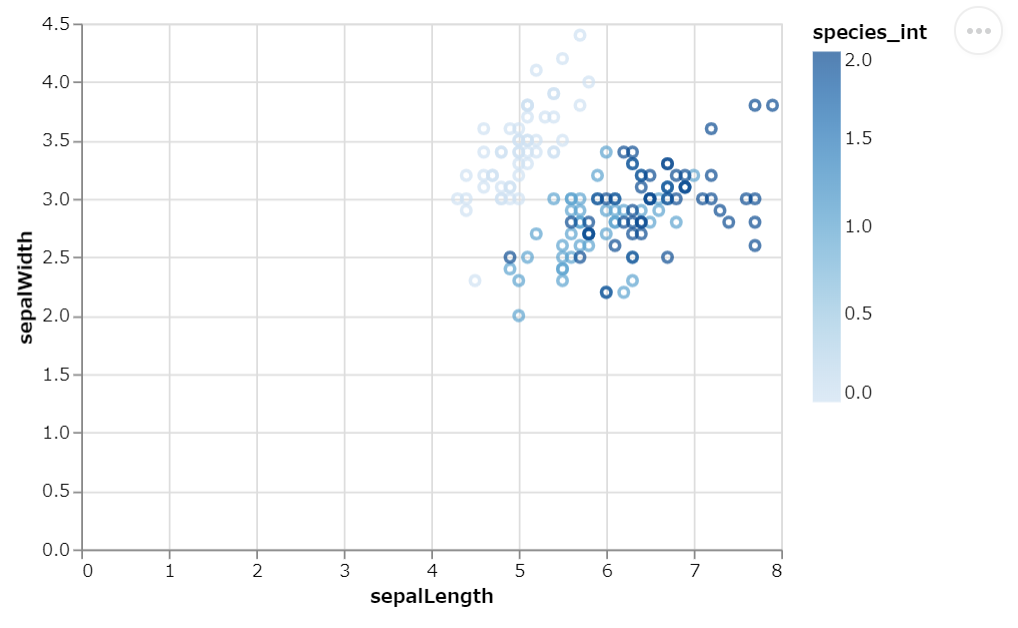
名義尺度が整数になっていることはよくありますよね。そのときはspecies_int:Nのように名義尺度であることを明示します。ちなみに順序尺度は:O、量的データなら:Qです。詳細は公式ドキュメントのここに記載があります。
# 整数値に変換 (setosa: 0, versicolor: 1, virginica: 2)
iris["species_int"] = [["setosa", "versicolor", "virginica"].index(x) for x in iris["species"]]

# 正しい例
alt.Chart(iris).mark_point().encode(
    x="sepalLength",
    y="sepalWidth",
    color="species_int:N"
).interactive()
MaxRowError対応
5000行超えると怒られます。ここの情報を参考に以下を実行。
alt.data_transformers.disable_max_rows()
最後に
シンプルに記述できて探索的な分析には便利です。欠点があるとすると、htmlの出力は簡単ですがpngの出力がやや大変そうでした。参考になれば!
