この記事はスタンバイ Advent Calendar 2021の10日目の記事です。
はじめに
みなさんごきげんよう
久しぶりのQiita投稿です。(約1年ぶり)
メモ代わりにQiitaとboostnoteを使っていたのですが、1年前にNotionに出会ってからQiita投稿が疎かになっていました。
今回の記事は、RallyというElasticsearchの負荷ツールの特徴・使い方を書いていきたいなと思います。
細かい用語の説明は必要な箇所だけにしています。
公式ドキュメントがしっかりしているのでそちらを参考にしてください。
Rallyとは
- Elastic社が開発・利用しているPythonベースのElasticsearchのベンチマークツールです。
- gatlingなど、世に溢れている負荷テストツールと大枠は同じ
- 元々Elastic社内で使っていたものをOSS化したもの
いつの間にかパフォーマンス悪くなってたみたいな、茹でガエル状態を防ぐために、Elasticsearchのmasterブランチに対して、Rallyを使い毎晩負荷テストを行なっているらしいです。
↓実際に負荷テストの結果も公開されています。(以下リンク先の11月2日時点のスクリーンショット)
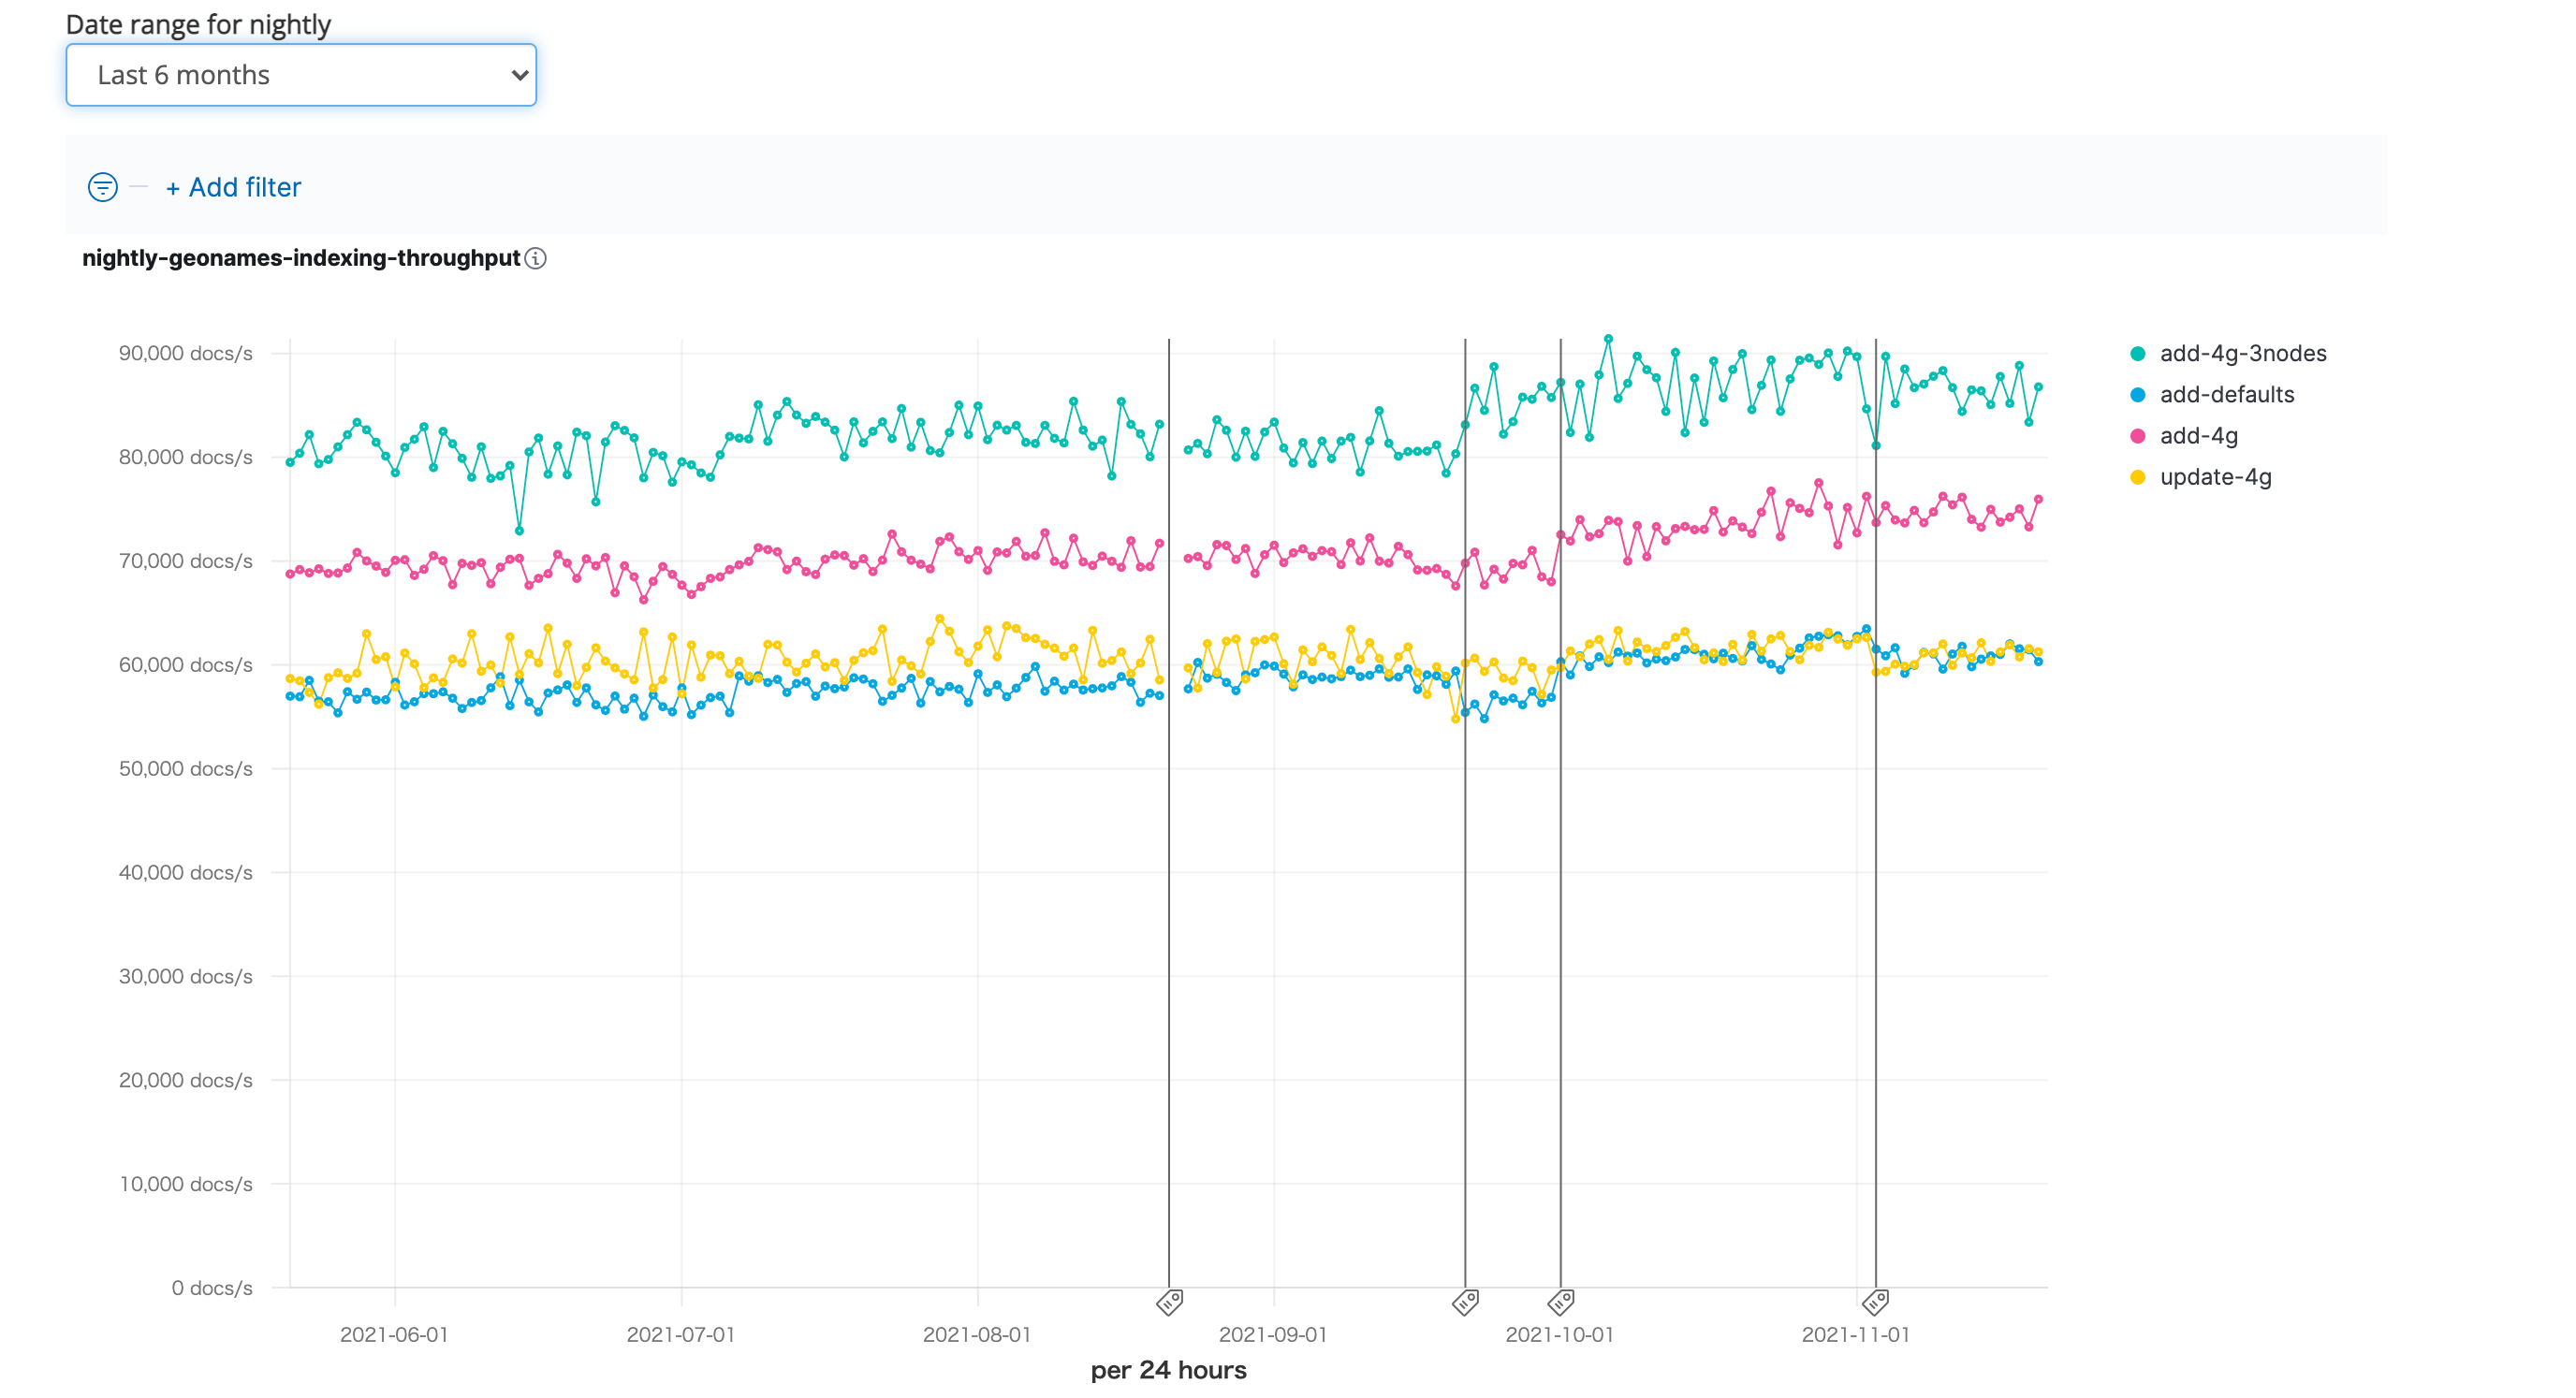
この他にも、現在のElasticsearchのスループットがここ半年でどのように推移してきてるのかなど、さまざまなメトリクスが見れるので眺めてるだけで面白いです。
他ツールと比べてどこが良い??
Rallyの主な特徴を以下3点かなと思います。
- Elasticsearch、テストデータを自前で用意しなくても良い
- 負荷テスト結果を詳しく表示してくれる
- 結果同士を比較することができる
では一つずつ詳しく紹介していきます。
Elasticsearch、テストデータを自前で用意しなくても良い
利用目的にもよりますが、Rallyをインストールして以下のようにワンコマンドで負荷テストを行うことができます。
$ esrally race --distribution-version=6.5.3 --track=geonames
上記コマンドは以下の処理を実行することを表しています。
- Elasticsearch version6.5.3のバイナリをダウンロード・起動
- geonamesという公式で用意されているテストデータ・Elasticsearchに対する操作等を指定
つまり、Elasticsearchの立ち上げ、index・mappingなどの設定、負荷テスト実施・結果表示を一気にやってくれるわけです。
めっちゃ便利ですね。
※tracksとは
どのようなデータで、どのような操作をElasticsearchに対して行うのかを定義したもの。
例えば、↑で指定したgeonamesで言うと、名前から連想できるように、地理情報に関するテストデータが用意されています。
{
  "geonameid": 2986043,
  "name": "Pic de Font Blanca",
  "asciiname": "Pic de Font Blanca",
  "alternatenames": "Pic de Font Blanca,Pic du Port",
  "feature_class": "T",
  "feature_code": "PK",
  "country_code": "AD",
  "admin1_code": "00",
  "population": 0,
  "dem": "2860",
  "timezone": "Europe/Andorra",
  "location": [
    1.53335,
    42.64991
  ]
}
また、以下のような操作をElasticsearchに対して行うように定義されています。
bulk insertしたり、様々なクエリで検索をかける処理が記載されています。
{
      "name": "index-append",
      "operation-type": "bulk",
      "bulk-size": {{bulk_size | default(5000)}},
      "ingest-percentage": {{ingest_percentage | default(100)}}
    },
    {
      "name": "index-update",
      "operation-type": "bulk",
      "bulk-size": {{bulk_size | default(5000)}},
      "ingest-percentage": {{ingest_percentage | default(100)}},
      "conflicts": "{{conflicts | default('random')}}",
      "on-conflict": "{{on_conflict | default('index')}}",
      "conflict-probability": {{conflict_probability | default(25)}},
      "recency": {{recency | default(0)}}
    },
    {
      "name": "default",
      "operation-type": "search",
      "body": {
        "query": {
          "match_all": {}
        }
      }
    },
    {
      "name": "term",
      "operation-type": "search",
      "body": {
        "query": {
          "term": {
            "country_code.raw": "AT"
          }
        }
      }
    }
...
geonames以外にも、その他様々なtracksが公式で用意されています。
- pmc: https://github.com/elastic/rally-tracks/tree/master/pmc
- 医学論文を集めたテストデータ
- http_logs: https://github.com/elastic/rally-tracks/tree/master/http_logs
- 1998年のワールドカップのwebサーバログ
Elasticseachのユースケースは様々あり、どのようなデータ・検索条件を扱うかなど、ユースケースによって負荷テストに必要なテストデータや、実際に行う操作(検索クエリなど)が全く異なります。
そのため、ユースケースに沿った負荷テストを行えるように様々なtracksが公式で用意されています。
自前でテストデータ、Elasticsearchに対する操作を定義する方法は後述しています。
負荷テスト結果を詳しく表示してくれる
以下のように負荷テスト結果が詳しく出力されます。
- JVMのメトリクス
- indexやsearchなどのtype毎のlatency, service time
- service time: latencyから待機時間を除いたもの。
個人的には、latencyとservice timeをどちらも出力してくれるのがありがたいです。
クエリに計算ロジックを追加する際などに、service timeを出力してくれると純粋にどれだけ処理速度が遅くなったのか明確にできるからです。
|                         Metric |                 Task |     Value |   Unit |
|-------------------------------:|---------------------:|----------:|-------:|
|            Total indexing time |                      |   28.0997 |    min |
|               Total merge time |                      |   6.84378 |    min |
|             Total refresh time |                      |   3.06045 |    min |
|               Total flush time |                      |  0.106517 |    min |
|      Total merge throttle time |                      |   1.28193 |    min |
|               Median CPU usage |                      |     471.6 |      % |
|             Total Young Gen GC |                      |    16.237 |      s |
|               Total Old Gen GC |                      |     1.796 |      s |
|                     Index size |                      |   2.60124 |     GB |
|                  Total written |                      |   11.8144 |     GB |
|         Heap used for segments |                      |   14.7326 |     MB |
|       Heap used for doc values |                      |  0.115917 |     MB |
|            Heap used for terms |                      |   13.3203 |     MB |
|            Heap used for norms |                      | 0.0734253 |     MB |
|           Heap used for points |                      |    0.5793 |     MB |
|    Heap used for stored fields |                      |  0.643608 |     MB |
|                  Segment count |                      |        97 |        |
|                 Min Throughput |         index-append |   31925.2 | docs/s |
|              Median Throughput |         index-append |   39137.5 | docs/s |
|                 Max Throughput |         index-append |   39633.6 | docs/s |
|      50.0th percentile latency |         index-append |   872.513 |     ms |
|      90.0th percentile latency |         index-append |   1457.13 |     ms |
|      99.0th percentile latency |         index-append |   1874.89 |     ms |
|       100th percentile latency |         index-append |   2711.71 |     ms |
| 50.0th percentile service time |         index-append |   872.513 |     ms |
| 90.0th percentile service time |         index-append |   1457.13 |     ms |
| 99.0th percentile service time |         index-append |   1874.89 |     ms |
|  100th percentile service time |         index-append |   2711.71 |     ms |
|                           ...  |                  ... |       ... |    ... |
|                           ...  |                  ... |       ... |    ... |
|                 Min Throughput |     painless_dynamic |   2.53292 |  ops/s |
|              Median Throughput |     painless_dynamic |   2.53813 |  ops/s |
|                 Max Throughput |     painless_dynamic |   2.54401 |  ops/s |
|      50.0th percentile latency |     painless_dynamic |    172208 |     ms |
|      90.0th percentile latency |     painless_dynamic |    310401 |     ms |
|      99.0th percentile latency |     painless_dynamic |    341341 |     ms |
|      99.9th percentile latency |     painless_dynamic |    344404 |     ms |
|       100th percentile latency |     painless_dynamic |    344754 |     ms |
| 50.0th percentile service time |     painless_dynamic |    393.02 |     ms |
| 90.0th percentile service time |     painless_dynamic |   407.579 |     ms |
| 99.0th percentile service time |     painless_dynamic |   430.806 |     ms |
| 99.9th percentile service time |     painless_dynamic |   457.352 |     ms |
|  100th percentile service time |     painless_dynamic |   459.474 |     ms |
結果同士を比較することができる
↓のようにdiffを取ってくれるので、一目で結果を比較することができるようになっています。
|                                                        Metric |         Task |    Baseline |   Contender |     Diff |    Unit |        Diff % |
|--------------------------------------------------------------:|-------------:|------------:|------------:|---------:|--------:|--------------:|
|                    Cumulative indexing time of primary shards |              |     12.9848 |     41.3664 |  28.3816 |     min |      +218.58% |
|             Min cumulative indexing time across primary shard |              |           0 |     8.21065 |  8.21065 |     min |         0.00% |
|          Median cumulative indexing time across primary shard |              |           0 |     8.28183 |  8.28183 |     min |         0.00% |
|             Max cumulative indexing time across primary shard |              |     12.9848 |     8.33882 | -4.64598 |     min |       -35.78% |
|           Cumulative indexing throttle time of primary shards |              |   0.0736167 |    0.129767 |  0.05615 |     min |       +76.27% |
|    Min cumulative indexing throttle time across primary shard |              |           0 |           0 |        0 |     min |         0.00% |
| Median cumulative indexing throttle time across primary shard |              |           0 |   0.0273333 |  0.02733 |     min |         0.00% |
|    Max cumulative indexing throttle time across primary shard |              |   0.0736167 |     0.05365 | -0.01997 |     min |       -27.12% |
|                       Cumulative merge time of primary shards |              |     32.6593 |     13.5746 | -19.0847 |     min |       -58.44% |
|                      Cumulative merge count of primary shards |              |          36 |         210 |      174 |         |      +483.33% |
|                Min cumulative merge time across primary shard |              |           0 |     2.53468 |  2.53468 |     min |         0.00% |
|             Median cumulative merge time across primary shard |              |           0 |     2.74402 |  2.74402 |     min |         0.00% |
ここまで
ここまでRallyでどういったことをができるのかをおおまかに解説してきました。
ここからは、Rallyを調べていて個人的に気になっていた箇所をQA形式で解説しています。
実際に、Rallyをインストールして負荷テストを行う方法は、最後に記載しています。
Q1. shard・replica数は変更できる?
できる
rally.iniにshard数の設定ができる。
$ pwd
/Users/kinsho/.rally

$ ls
benchmarks   logging.json logs         rally.ini

$ vi rally.ini

datastore.number_of_shards = 3
datastore.number_of_replicas = 3
参考:https://esrally.readthedocs.io/en/stable/configuration.html#configuration
Q2. 既存のElasticsearch clusterに対して負荷テスト実行できる??
できる
--target-hostsに既存Elasticsearchのホスト名を指定できる。
--pipeline=benchmark-onlyは、Elasticsearchをプロビジョニングしないと指定している。
$ esrally race --track=pmc --target-hosts=http://localhost:9200 --pipeline=benchmark-only
参考:https://esrally.readthedocs.io/en/stable/recipes.html#benchmarking-an-existing-cluster
Q3. 任意のテストデータ・Elasticsearchに対する操作で負荷テスト実行できる?
できる
↓ 作り方は公式ドキュメントに詳しく記載されている。
https://esrally.readthedocs.io/en/stable/adding_tracks.html
Q4.search template経由で負荷テスト実行できる?
できる
tracksの定義に以下3点を定義する
-
operation-type=raw-request- これを指定すると任意のHTTPリクエストを実行することができる。
path=/_search/template
例)
{
  "version": 2,
  "description": "Tutorial benchmark for Rally",
  "indices": [
    {
      "name": "ad_job"
    }
  ],
  "corpora": [
    {
      "name": "rally-tutorial",
      "documents": [
        {
          "source-file": "documents.json",
          "document-count": 12215630,
          "uncompressed-bytes": 1619815552
        }
      ]
    }
  ],
  "schedule": [
    {
      "operation": {
        "name": "query-by-template",
        "operation-type": "raw-request", # ここ
        "method": "GET", # ここ
        "path": "/_search/template", # ここ
        "body": {
          "id": "template_1",
          "params": {
            "name": "kinsho"
          }
        }
      },
      "warmup-iterations": 100,
      "iterations": 100,
      "target-throughput": 100
    }
  ]
}
Q5. insert, searchなど複数処理を並列で負荷テスト実行できる?
できる
tracksの定義に以下3点を定義する
-
parallelkeyを指定
以下例では、bluk insertとsearchを並列で行っている
{
  "version": 2,
  "description": "Tutorial benchmark for Rally",
  "indices": [
    {
      "name": "ad_job"
    }
  ],
  "corpora": [
    {
      "name": "rally-tutorial",
      "documents": [
        {
          "source-file": "documents.json",
          "document-count": 12215630,
          "uncompressed-bytes": 1619815552
        }
      ]
    }
  ],
  "schedule": [
    {
      "parallel": { # ここ
      "tasks": [
        {
          "name": "index",
          "operation": {
            "operation-type": "bulk",
            "bulk-size": 1000
          },
          "client": 2,
          "warmup-iterations": 100,
          "iterations": 100
        },
        {
          "name": "search",
          "operation": {
            "name": "query-by-template",
            "operation-type": "raw-request",
            "method": "GET",
            "path": "/_search/script_template",
            "body": {
              "id": "ad_search_v20211111",
              "params": {
                "name": "kinsho"
              }
            }
          },
          "client": 2,
          "warmup-iterations": 100,
          "iterations": 100,
          "target-throughput": 10
        }
      ]
    }
  }]
}
Q6. その他使えそうなtracksの定義
client
何並列で実行するのか指定できる
↓の場合、search template経由でのsearch処理を2並列で行う
{
   "operation":{
      "name":"query-by-template",
      "operation-type":"raw-request",
      "method":"GET",
      "path":"/_search/script_template",
      "body":{
         "id":"ad_search_v20211111",
         "params":{
            "name":"kinsho"
         }
      }
   },
   "client":2, # ここ
   "warmup-iterations":100,
   "iterations":100,
   "target-throughput":10
}
target-throughput
throughputを指定できる(単位は秒)
↓の例では、10requests/sで負荷をかける
※ client=2になっているので、それぞれのclientは5requests/sの負荷をかける
{
   "operation":{
      "name":"query-by-template",
      "operation-type":"raw-request",
      "method":"GET",
      "path":"/_search/script_template",
      "body":{
         "id":"ad_search_v20211111",
         "params":{
            "name":"kinsho"
         }
      }
   },
   "client":2, # ここ
   "warmup-iterations":100,
   "iterations":1000,
   "target-throughput":10
}
iterations
定義した操作を何回行うか指定できる
最低1000回を指定しないと、99%tileのメトリクスが出力されない
参考:https://esrally.readthedocs.io/en/stable/track.html?highlight=challenge#schedule
Rallyのユースケース
ここまでRallyの特徴を細かいところまで見てきました。
それを踏まえて、Rallyはこんなところで使えるんちゃうかって言うのをまとめています。
- 既存のESに対して負荷試験
- insert, update, delete, searchを並列で行う
- ESを新しく作る時
- cluster構成を考える際に役に立つ
- JVMメトリクスも見て、ノード・shard数を決めれる
- ESバージョン毎の比較など
- 7xと8xで比較など
- サクッとメトリクス取得できるので、バージョンアップさせるメリット等を数値で表せる
- 特定クエリに対する計算速度比較
- painlessで重い計算をするような実装をする際に、どれくらい重くなるのかなど見れる
- service timeが便利
実際に負荷テストやってみる
今回は以下のユースケースに沿った負荷テストを行ってみました。
- 既存のElasticsearch
- index・mappingの設定、dataのindexは完了済みの前提
- 自前のテストデータを利用
- indexとsearchを並列で行う
- searchではsearch templateを利用する
環境
macOS Big Sur 11.5.2
openjdk version "1.8.0_232"
Python 3.8.2
pip3 21.2.4
Rallyのinstall
Rallyをinstallするには、以下が必要です。
- python3.8以上(pip3含む)
- git1.9以上
- 公式のtracksをgitからダウンロードするために必要
- Elasticsearchを動かすために必要なJDK
- JDK 1.8を入れとけば、Elasticsearch 7.15まで動く(https://www.elastic.co/jp/support/matrix#matrix_jvm)
$ pip3 install esrally
.rally/ディレクトリの確認
~/.rallyができているのか確認
$ cd ~/.rally
$ ls
benchmarks   logging.json logs         rally.ini
Elasticsearchの起動
docker-compose.ymlに必要なElasticsearchを定義している前提です。
$ ls
docker-compose.yml

$ docker compose up -d
起動確認
$ curl http://localhost:19200
{
  "name" : "471b650c43d2",
  "cluster_name" : "elasticsearch",
  "cluster_uuid" : "Ma4Pabu8TNG3N0P4xCa4VA",
  "version" : {
    "number" : "7.5.2",
    "build_flavor" : "default",
    "build_type" : "docker",
    "build_hash" : "8bec50e1e0ad29dad5653712cf3bb580cd1afcdf",
    "build_date" : "2020-01-15T12:11:52.313576Z",
    "build_snapshot" : false,
    "lucene_version" : "8.3.0",
    "minimum_wire_compatibility_version" : "6.8.0",
    "minimum_index_compatibility_version" : "6.0.0-beta1"
  },
  "tagline" : "You Know, for Search"
}
起動したElasticsearchから自前でtracks、テストデータを作成する
すでにElasticsearchにデータが入っている場合、そこからテストデータを自動で作成できます。
$ esrally create-track --track=test --target-hosts=127.0.0.1:19200 --indices="test" --output-path=~/rally
    ____        ____
   / __ \____ _/ / /_  __
  / /_/ / __ `/ / / / / /
 / _, _/ /_/ / / / /_/ /
/_/ |_|\__,_/_/_/\__, /
                /____/

[INFO] Connected to Elasticsearch cluster [471b650c43d2] version [7.5.2].

Extracting documents for index [test] for test mode...    1000/1000 docs [100.0% done]
Extracting documents for index [test]...                16370/16370 docs [100.0% done]

[INFO] Track test has been created. Run it with: esrally --track-path=/Users/kinsho/rally/test

---------------------------------
[INFO] SUCCESS (took 117 seconds)
---------------------------------
全データからtracksを作成するので、データ量が多い場合は時間かかりすぎるので注意が必要です。
作成したデータの確認
$ cd ~/rally/test
$ ls
test-documents-1k.json     test-documents.json        test.json
test-documents-1k.json.bz2 test-documents.json.bz2    track.json
-
test-documents.json: 作成したテストデータ -
test.json: 作成元Elasticsearchのindex、mappingの設定が記載されている -
track.json: 自動で定義されたtracks。
次はindexとsearchを並列で行えるようにtracks.jsonを編集していきます。
indexとsearchを並列で行うように変更する
一つ前で自動生成されたtracks.jsonを確認すると以下のような定義になっています。
schedule以降を見ると、indexの削除・作成、ヘルスチェック、bulk indexが負荷テストの内容として定義されていることがわかります。
{% import "rally.helpers" as rally with context %}
{
  "version": 2,
  "description": "Tracker-generated track for ad_job",
  "indices": [
    {
      "name": "test",
      "body": "test.json"
    }
  ],
  "corpora": [
    {
      "name": "test",
      "documents": [
        {
          "target-index": "test",
          "source-file": "test-documents.json.bz2",
          "document-count": 16370,
          "compressed-bytes": 21288873,
          "uncompressed-bytes": 245756331
        }
      ]
    }
  ],
  "schedule": [
    {
      "operation": "delete-index"
    },
    {
      "operation": {
        "operation-type": "create-index",
        "settings": {{index_settings | default({}) | tojson}}
      }
    },
    {
      "operation": {
        "operation-type": "cluster-health",
        "index": "test",
        "request-params": {
          "wait_for_status": "{{cluster_health | default('green')}}",
          "wait_for_no_relocating_shards": "true"
        },
        "retry-until-success": true
      }
    },
    {
      "operation": {
        "operation-type": "bulk",
        "bulk-size": {{bulk_size | default(5000)}},
        "ingest-percentage": {{ingest_percentage | default(100)}}
      },
      "clients": {{bulk_indexing_clients | default(8)}}
    }
  ]
}
schedule配下を以下のように編集します。
{
  "version": 2,
  "description": "Tracker-generated track for ad_job",
  "indices": [
    {
      "name": "test"
    }
  ],
  "corpora": [
    {
      "name": "test",
      "documents": [
        {
          "target-index": "test",
          "source-file": "test-documents.json.bz2",
          "document-count": 16370,
          "compressed-bytes": 21288873,
          "uncompressed-bytes": 245756331
        }
      ]
    }
  ],
  "schedule": [
    {
      "parallel": {
      "tasks": [
        {
          "name": "health",
          "operation": {
            "operation-type": "cluster-health",
            "index": "test",
            "request-params": {
              "wait_for_status": "{{cluster_health | default('green')}}",
              "wait_for_no_relocating_shards": "true"
            },
            "retry-until-success": true
          }
        },
        { # ここ
          "name": "index",
          "operation": {
            "operation-type": "bulk",
            "bulk-size": 1000
          }
        },
        { # ここ
          "name": "search",
          "operation": {
            "name": "search",
            "operation-type": "search",
            "body": {
            "query": {
                "match_all": {}
              }
            }
          }
        }
      ]
    }
  }]
}
parallel配列に、並列処理したいオペレーションを定義しています。
search templateを利用する
searchのオペレーションを変更します。
{
  "version": 2,
  "description": "Tracker-generated track for ad_job",
  "indices": [
    {
      "name": "test"
    }
  ],
  "corpora": [
    {
      "name": "test",
      "documents": [
        {
          "target-index": "test",
          "source-file": "test-documents.json.bz2",
          "document-count": 16370,
          "compressed-bytes": 21288873,
          "uncompressed-bytes": 245756331
        }
      ]
    }
  ],
  "schedule": [
    {
      "parallel": {
      "tasks": [
        {
          "name": "health",
          "operation": {
            "operation-type": "cluster-health",
            "index": "test",
            "request-params": {
              "wait_for_status": "{{cluster_health | default('green')}}",
              "wait_for_no_relocating_shards": "true"
            },
            "retry-until-success": true
          }
        },
        {
          "name": "index",
          "operation": {
            "operation-type": "bulk",
            "bulk-size": 1000
          }
        },
        {
          "name": "search",
          "operation": {
            "name": "search",
            "operation-type": "raw-request", # ここ
            "method": "GET", # ここ
            "path": "/_search/template", # ここ
            "body": {
            "query": { # ここ
                "id": "ad_search_v20211111",
                "params": {

                }
              }
            }
          }
        }
      ]
    }
  }]
}
実行回数、並列数などを指定する
{
  "version": 2,
  "description": "Tracker-generated track for ad_job",
  "indices": [
    {
      "name": "test"
    }
  ],
  "corpora": [
    {
      "name": "test",
      "documents": [
        {
          "target-index": "test",
          "source-file": "test-documents.json.bz2",
          "document-count": 16370,
          "compressed-bytes": 21288873,
          "uncompressed-bytes": 245756331
        }
      ]
    }
  ],
  "schedule": [
    {
      "parallel": {
      "tasks": [
        {
          "name": "health",
          "operation": {
            "operation-type": "cluster-health",
            "index": "test",
            "request-params": {
              "wait_for_status": "{{cluster_health | default('green')}}",
              "wait_for_no_relocating_shards": "true"
            },
            "retry-until-success": true
          }
        },
        {
          "name": "index",
          "operation": {
            "operation-type": "bulk",
            "bulk-size": 1000
          },
          "client": 2, # ここ
          "warmup-iterations": 100, # ここ
          "iterations": 100 # ここ
        },
        {
          "name": "search",
          "operation": {
            "name": "search",
            "operation-type": "raw-request",
            "method": "GET",
            "path": "/_search/template",
            "body": {
            "query": {
                "id": "ad_search_v20211111",
                "params": {

                }
              }
            }
          },
          "client": 2, # ここ
          "warmup-iterations": 100, # ここ
          "iterations": 100, # ここ
          "target-throughput": 10 # ここ
        }
      ]
    }
  }]
}
実行する
--track-pathには、ここまで色々変更してきたtracks.jsonが格納されているディレクトリを指定します。
$ esrally race --target-hosts=http://localhost:19200 --track-path=~/rally/test --pipeline=benchmark-only
結果
|---------------------------------------------------------------:|-------:|------------:|-------:|
|                     Cumulative indexing time of primary shards |        |    0.258217 |    min |
|             Min cumulative indexing time across primary shards |        |           0 |    min |
|          Median cumulative indexing time across primary shards |        |  0.00791667 |    min |
|             Max cumulative indexing time across primary shards |        |     0.01115 |    min |
|            Cumulative indexing throttle time of primary shards |        |           0 |    min |
|    Min cumulative indexing throttle time across primary shards |        |           0 |    min |
| Median cumulative indexing throttle time across primary shards |        |           0 |    min |
|    Max cumulative indexing throttle time across primary shards |        |           0 |    min |
|                        Cumulative merge time of primary shards |        |           0 |    min |
|                       Cumulative merge count of primary shards |        |           0 |        |
|                Min cumulative merge time across primary shards |        |           0 |    min |
|             Median cumulative merge time across primary shards |        |           0 |    min |
|                Max cumulative merge time across primary shards |        |           0 |    min |
|               Cumulative merge throttle time of primary shards |        |           0 |    min |
|       Min cumulative merge throttle time across primary shards |        |           0 |    min |
|    Median cumulative merge throttle time across primary shards |        |           0 |    min |
|       Max cumulative merge throttle time across primary shards |        |           0 |    min |
|                      Cumulative refresh time of primary shards |        | 1.66667e-05 |    min |
|                     Cumulative refresh count of primary shards |        |          66 |        |
|              Min cumulative refresh time across primary shards |        |           0 |    min |
|           Median cumulative refresh time across primary shards |        |           0 |    min |
|              Max cumulative refresh time across primary shards |        | 1.66667e-05 |    min |
|                        Cumulative flush time of primary shards |        |       5e-05 |    min |
|                       Cumulative flush count of primary shards |        |          33 |        |
|                Min cumulative flush time across primary shards |        |           0 |    min |
|             Median cumulative flush time across primary shards |        |           0 |    min |
|                Max cumulative flush time across primary shards |        | 3.33333e-05 |    min |
|                                        Total Young Gen GC time |        |       0.222 |      s |
|                                       Total Young Gen GC count |        |          43 |        |
|                                          Total Old Gen GC time |        |           0 |      s |
|                                         Total Old Gen GC count |        |           0 |        |
|                                                     Store size |        |    0.201253 |     GB |
|                                                  Translog size |        |   0.0373555 |     GB |
|                                         Heap used for segments |        |    0.611448 |     MB |
|                                       Heap used for doc values |        |    0.185928 |     MB |
|                                            Heap used for terms |        |    0.353743 |     MB |
|                                            Heap used for norms |        |   0.0234375 |     MB |
|                                           Heap used for points |        |  0.00320435 |     MB |
|                                    Heap used for stored fields |        |    0.027565 |     MB |
|                                                  Segment count |        |          32 |        |
|                                                 Min Throughput |  index |     9221.03 | docs/s |
|                                                Mean Throughput |  index |     9426.97 | docs/s |
|                                              Median Throughput |  index |     9447.74 | docs/s |
|                                                 Max Throughput |  index |     9570.68 | docs/s |
|                                        50th percentile latency |  index |     74.1439 |     ms |
|                                        90th percentile latency |  index |     80.4569 |     ms |
|                                        99th percentile latency |  index |     86.3399 |     ms |
|                                       100th percentile latency |  index |     89.9768 |     ms |
|                                   50th percentile service time |  index |      72.177 |     ms |
|                                   90th percentile service time |  index |     77.1631 |     ms |
|                                   99th percentile service time |  index |     85.5153 |     ms |
|                                  100th percentile service time |  index |       85.81 |     ms |
|                                                     error rate |  index |           0 |      % |
|                                                 Min Throughput | search |       10.01 |  ops/s |
|                                                Mean Throughput | search |       10.01 |  ops/s |
|                                              Median Throughput | search |       10.01 |  ops/s |
|                                                 Max Throughput | search |       10.02 |  ops/s |
|                                        50th percentile latency | search |     45.9003 |     ms |
|                                        90th percentile latency | search |     53.3261 |     ms |
|                                        99th percentile latency | search |     58.6462 |     ms |
|                                       100th percentile latency | search |     59.2282 |     ms |
|                                   50th percentile service time | search |     43.1172 |     ms |
|                                   90th percentile service time | search |      51.079 |     ms |
|                                   99th percentile service time | search |     55.6922 |     ms |
|                                  100th percentile service time | search |     56.4722 |     ms |
|                                                     error rate | search |           0 |      % |
まとめ
Rallyは、それぞれのユースケースにあった負荷テストを行うことができるツールなので本当に便利です。
最後まで読んでくださりありがとうございました。
参考
公式ドキュメント:https://esrally.readthedocs.io/en/stable/index.html
Elastic社公式ブログ: https://www.elastic.co/jp/blog/announcing-rally-benchmarking-for-elasticsearch