1.KaggleのDigit Recognizer Competitionのデータを借りて画像認識に挑戦。
1.1.MNISTデータの取得
import numpy as np
import pandas as pd
import matplotlib.pyplot as plt
import seaborn as sns


#ファイルの読み込み
dftrain = pd.read_csv("train.csv")
dftest = pd.read_csv("test.csv")
print(dftrain.head())
dftrain.info()


########################      結果      ########################
   label  pixel0  pixel1  pixel2  pixel3  pixel4  pixel5  pixel6  pixel7  pixel8  pixel9  pixel10  ...  pixel772  pixel773  pixel774  pixel775  pixel776  pixel777  pixel778  pixel779  pixel780  pixel781  pixel782  pixel783
0      1       0       0       0       0       0       0       0       0       0       0        0  ...         0         0         0         0         0         0         0         0         0         0         0         0
1      0       0       0       0       0       0       0       0       0       0       0        0  ...         0         0         0         0         0         0         0         0         0         0         0         0
2      1       0       0       0       0       0       0       0       0       0       0        0  ...         0         0         0         0         0         0         0         0         0         0         0         0
3      4       0       0       0       0       0       0       0       0       0       0        0  ...         0         0         0         0         0         0         0         0         0         0         0         0
4      0       0       0       0       0       0       0       0       0       0       0        0  ...         0         0         0         0         0         0         0         0         0         0         0         0

[5 rows x 785 columns]

RangeIndex: 42000 entries, 0 to 41999
Columns: 785 entries, label to pixel783
dtypes: int64(785)
1.2.トレーニングデータをY(ラベル、目的変数)とX(ピクセル、説明変数)に分ける
ytrain = dftrain["label"]
xtrain = dftrain.drop(labels = ["label"],axis = 1)
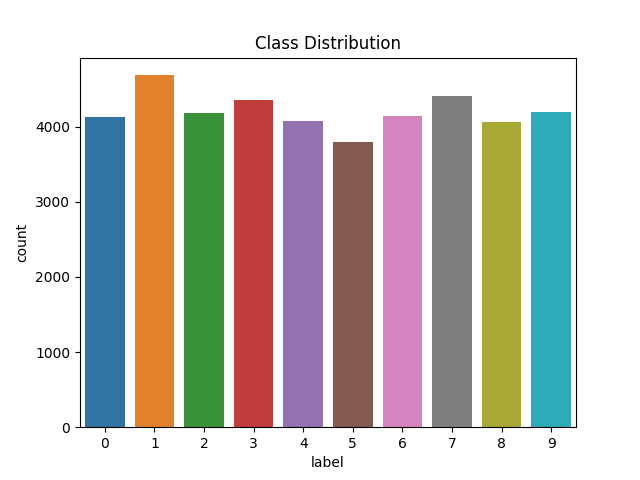
1.3.各数字の出現数を可視化
sns.countplot(ytrain)
plt.title('Class Distribution')
plt.show()
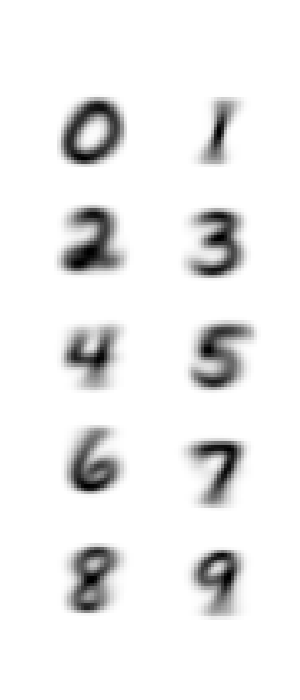
1.4.各数字の平均画像を可視化
平均画像:数字ごとにピクセルを全て合計して出現数で割った画像
#数字の0、1、2、3、4、5、6、7、8、9の平均を計算して出力する
plt.figure(figsize=(4, 9))
for i in [0, 1, 2, 3, 4, 5, 6, 7, 8, 9]:
    ytrain_i = dftrain[dftrain['label'] == i]
    xtrain_i = ytrain_i.drop(labels = ["label"],axis = 1)

    #数字iの画像の平均を求める
    mxtrain_i = xtrain_i.mean()
    mxtrain_i = np.array(mxtrain_i)
    plt.subplot(5, 2, i+1)
    plt.xticks([])
    plt.yticks([])
    sns.despine(top=True, right=True, left=True, bottom=True)
    plt.imshow(mxtrain_i.reshape(28,28), cmap=plt.cm.binary)

plt.show()
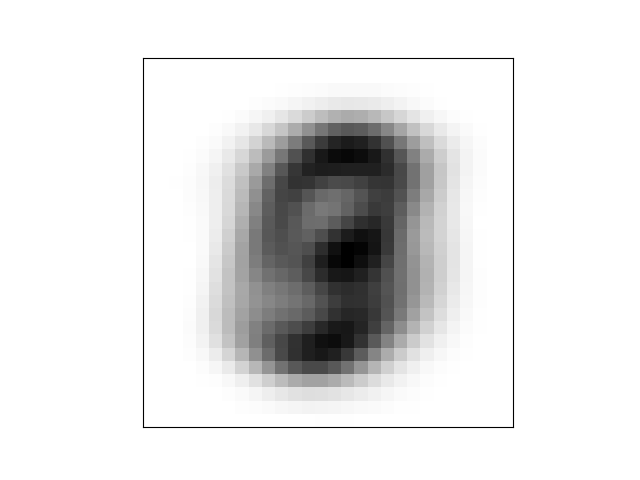
1.5.全部の画像の平均を可視化
mxtrain = xtrain.mean()
mxtrain = np.array(mxtrain)
plt.xticks([])
plt.yticks([])
plt.imshow(mxtrain.reshape(28,28), cmap=plt.cm.binary)
plt.show()
1.6."各数字の画像"と"全部の画像の平均"の差
fig = plt.figure(figsize=(5, 10))
k=1
for i in [0, 1, 2, 3, 4, 5, 6, 7, 8, 9]:
    ytrain_i = dftrain[dftrain['label'] == i]
    xtrain_i = ytrain_i.drop(labels = ["label"],axis = 1)

    #5つのiの画像と全画像の平均の差を求める
    xtrain_i = xtrain_i.to_numpy()
    for j in range(5):
        diff_j = mxtrain - xtrain_i[j]
        fig.add_subplot(10, 5, k)
        plt.xticks([])
        plt.yticks([])
        sns.despine(top=True, right=True, left=True, bottom=True)
        plt.imshow(diff_j.reshape(28,28), cmap=plt.cm.binary)
        k += 1
plt.show()
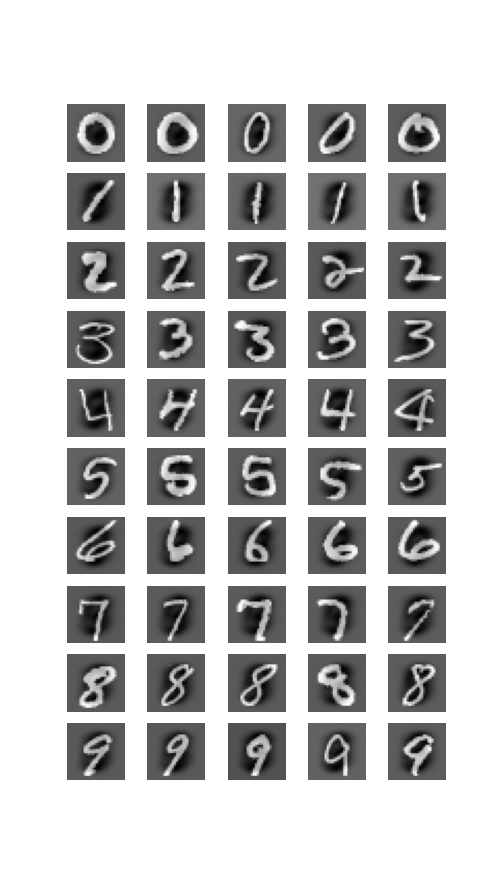
・明るいところほどピクセルが大きい。
・どこに強い特徴が存在するかの予想に使われる。
2.CNNのモデルを作る
◎トレーニングデータ、テストデータの作成
#トレーニングデータ、テストデータの作成
from sklearn.model_selection import train_test_split
from keras.utils.np_utils import to_categorical

ytrain = to_categorical(ytrain, num_classes = 10)
xtrain = xtrain.values.reshape(-1,28,28,1)

X_train, X_val, Y_train, Y_val = train_test_split(xtrain, ytrain, test_size = 0.15, random_state=2)
2.1.Seqentialモデルを作ってみるパート1!!!!!!
# Seqentialモデルを作ってみる
import tensorflow as tf
import keras
from keras.models import Sequential
from keras.layers import Dense, Activation, Conv2D, MaxPooling2D, Flatten


model = Sequential()

model.add(Conv2D(filters = 32, kernel_size = (5,5),padding = 'Same', activation ='relu', input_shape = (28,28,1)))
model.add(Conv2D(filters = 32, kernel_size = (5,5),padding = 'Same', activation ='relu'))
model.add(MaxPooling2D(pool_size=(2,2)))

model.add(Conv2D(filters = 64, kernel_size = (3,3),padding = 'Same', activation ='relu'))
model.add(Conv2D(filters = 64, kernel_size = (3,3),padding = 'Same', activation ='relu'))
model.add(MaxPooling2D(pool_size=(2,2), strides=(2,2)))

model.add(Flatten())
model.add(Dense(256, activation = "relu"))
model.add(Dense(10, activation = "softmax"))
2.1.1RMSpropで最適化
#RMSpropで最適化
from tensorflow import keras
from keras import optimizers

opt = keras.optimizers.RMSprop(lr=0.001, rho=0.9, epsilon=1e-08, decay=0.0)
model.compile(optimizer = opt, loss = "categorical_crossentropy", metrics=["accuracy"])
history = model.fit(X_train, Y_train, validation_split=0.25, epochs=30, batch_size=32, verbose=1)
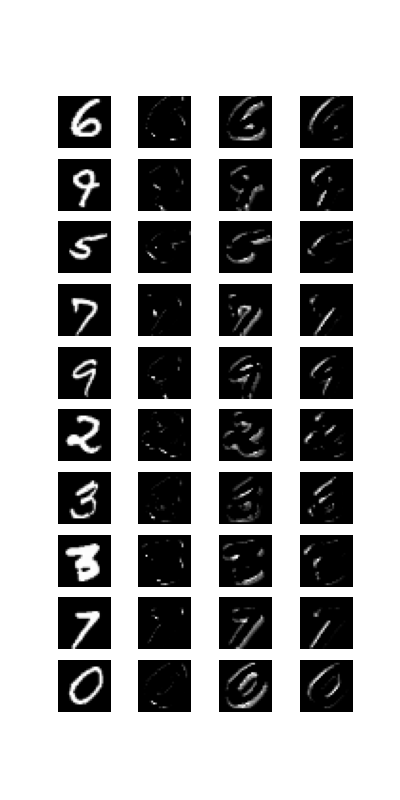
2.1.2.元画像と2層目(Conv5×5×32)の出力結果を3個を可視化
#学習済みモデルの1層目だけ取得してモデルを作成する
model_2 = Sequential()
model_2.add(model.layers[0])

fig = plt.figure(figsize=(4,8))
for i in range(10):
    ax = fig.add_subplot(10, 4, 4*i+1)
    ax.set_xticklabels([])
    ax.set_yticklabels([])
    ax.axis('off')
    ax.imshow(X_val[i][:, :, 0], cmap='gray')
    ax = fig.add_subplot(10, 4, 4*i+2)
    ax.set_xticklabels([])
    ax.set_yticklabels([])
    ax.axis('off')
    ax.imshow(model_2.predict(X_val[i:i+1])[0][:, :, 0], cmap='gray')
    ax = fig.add_subplot(10, 4, 4*i+3)
    ax.set_xticklabels([])
    ax.set_yticklabels([])
    ax.axis('off')
    ax.imshow(model_2.predict(X_val[i:i+1])[0][:, :, 1], cmap='gray')
    sns.despine(top=True, right=True, left=True, bottom=True)
    ax = fig.add_subplot(10, 4, 4*i+4)
    ax.set_xticklabels([])
    ax.set_yticklabels([])
    ax.axis('off')
    ax.imshow(model_2.predict(X_val[i:i+1])[0][:, :, 2], cmap='gray')
    sns.despine(top=True, right=True, left=True, bottom=True)
plt.show()

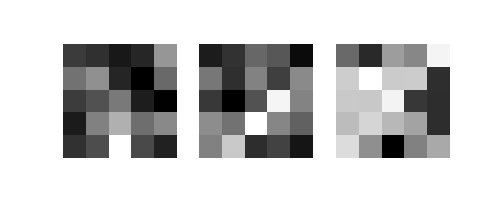
#一層目で使われたカーネルフィルタも3つ抽出する
fig = plt.figure(figsize = (5,2))
for i in range(3):
    w = model_2.get_weights()[0][:, :, 0, i].reshape(5, 5)
    ax = fig.add_subplot(1, 3, i+1)
    ax.set_xticklabels([])
    ax.set_yticklabels([])
    ax.axis('off')
    ax.imshow(w, cmap='gray_r')
plt.show()
◎二層目に通した後の出力
◎一層目で使われたカーネルフィルタ(5×5)
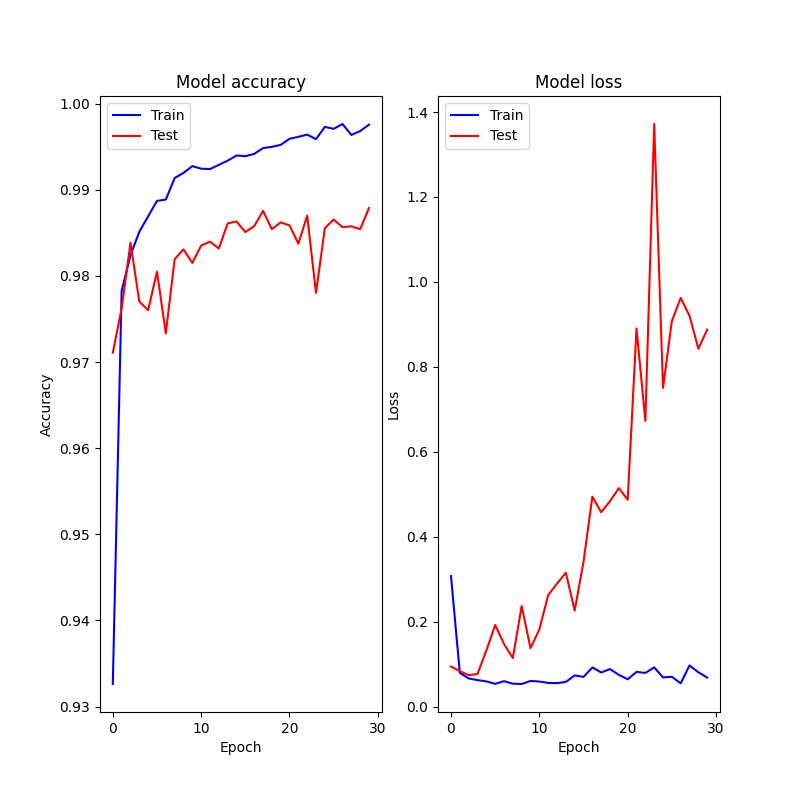
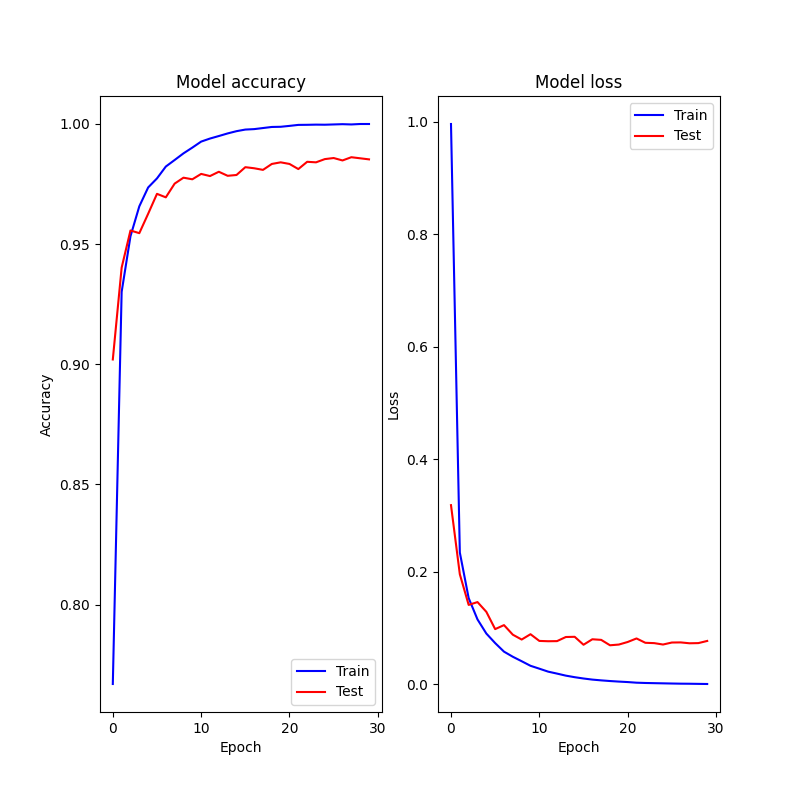
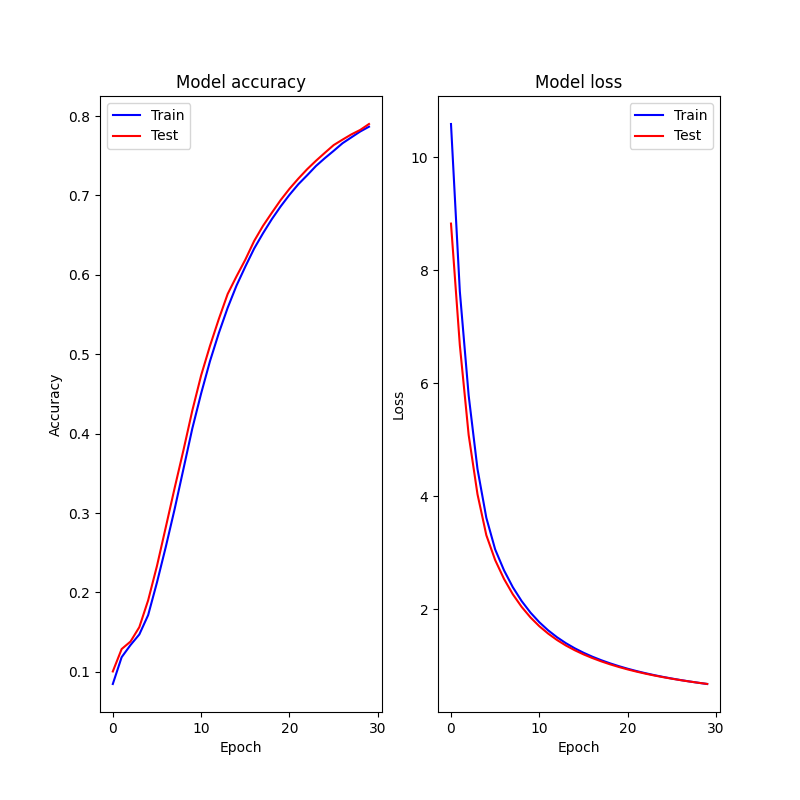
2.1.3.損失と正確さの可視化
fig = plt.figure(figsize=(8, 8))
#制度
fig.add_subplot(1, 2, 1)
acc = history.history['accuracy']
val_acc = history.history['val_accuracy']
plt.plot(acc, color='b', label="Training accuracy")
plt.plot(val_acc, color='r',label="Validation accuracy")
plt.title('Model accuracy')
plt.ylabel('Accuracy')
plt.xlabel('Epoch')
plt.legend(['Train', 'Test'], loc='best')

#損失
fig.add_subplot(1, 2, 2)
loss = history.history["loss"]
val_loss = history.history["val_loss"]
plt.plot(loss, color='b', label="Training loss")
plt.plot(val_loss, color='r', label="validation loss")
plt.title('Model loss')
plt.ylabel('Loss')
plt.xlabel('Epoch')
plt.legend(['Train', 'Test'], loc='best')
plt.show()
print(history)
◎学習率=0.001の時
◎学習率=1e-5の時
◎学習率=1e-7の時
◎学習率=0.001の時の結果
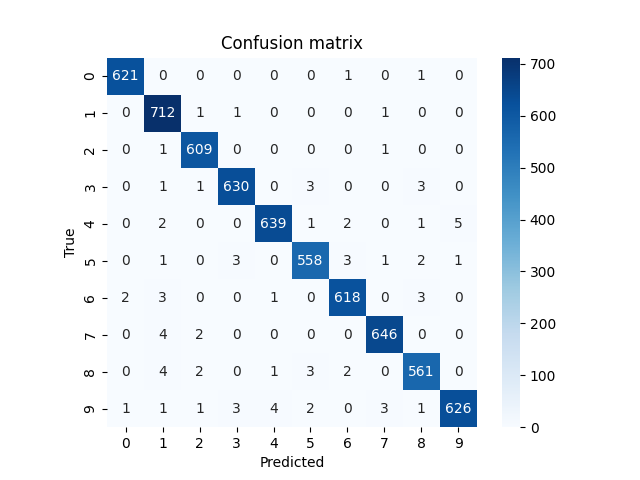
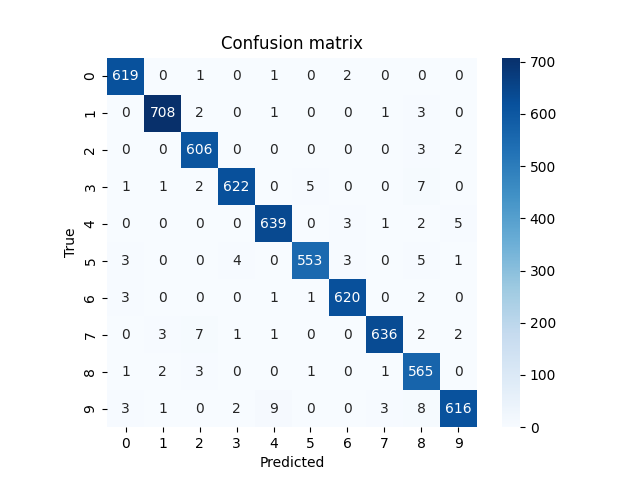
正誤状況をヒートマップで確認
from sklearn.metrics import confusion_matrix
from decimal import Decimal
Y_pred = model.predict(X_val)
Y_pred_classes = np.argmax(Y_pred, axis = 1)
Y_true = np.argmax(Y_val, axis = 1)
cm = confusion_matrix(Y_true, Y_pred_classes)
sns.heatmap(cm, square=True, cbar=True, annot=True, cmap='Blues', fmt='.0f')
plt.title('Confusion matrix')
plt.xlabel("Predicted")
plt.ylabel("True")
plt.show()
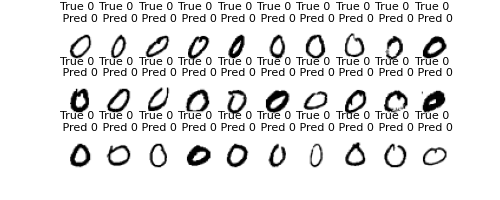
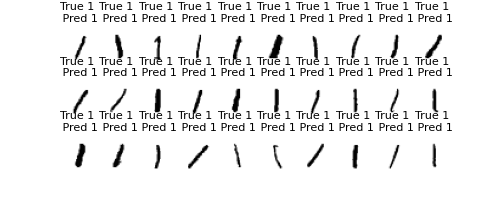
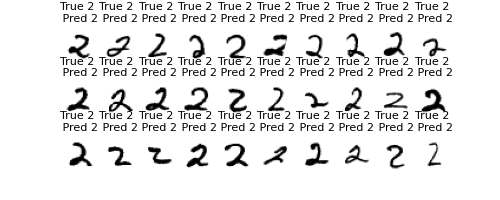
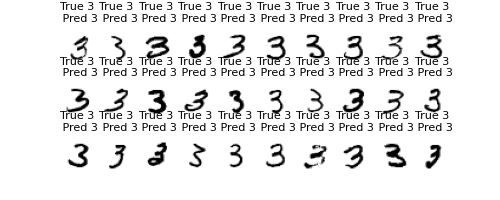
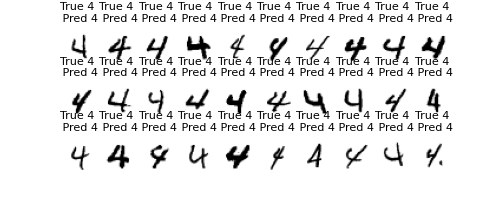
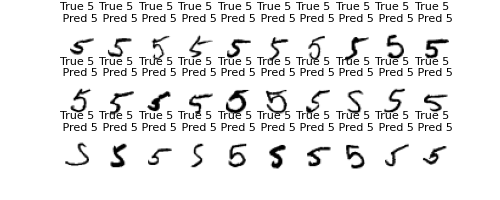
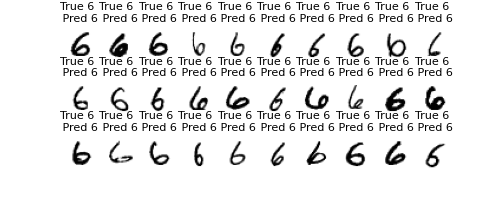
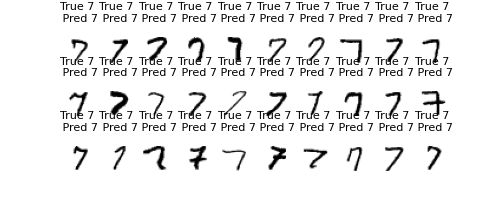
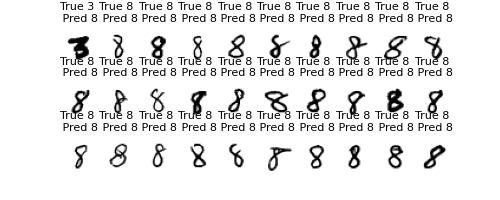
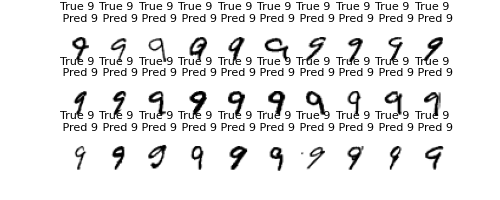
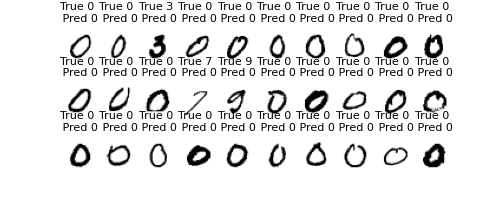
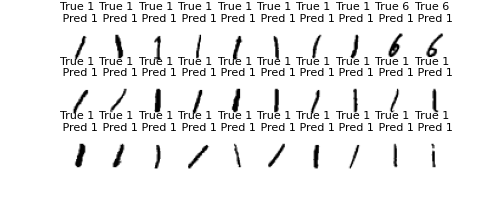
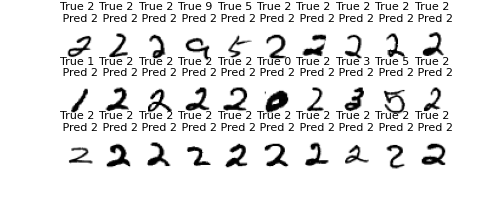
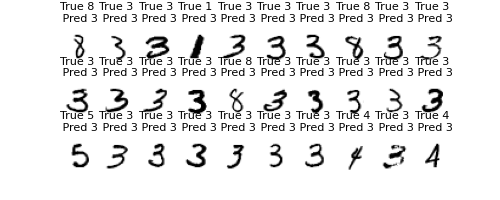
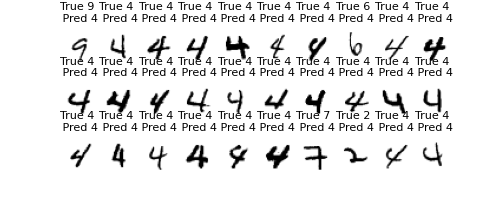
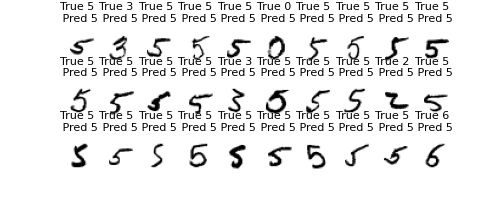
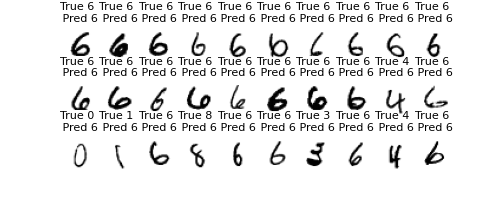
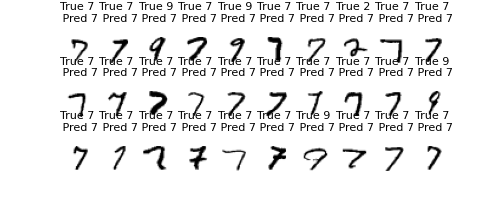
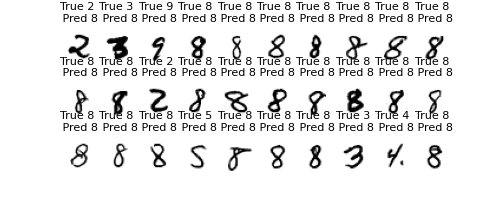
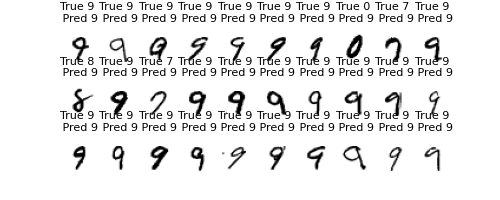
各数字30個取り出して正誤を見てみる
X_val2 = X_val.reshape(X_val.shape[0], 28, 28)
print(Y_pred_classes)
print(Y_true)
print(Y_pred_classes.shape)
print(Y_true.shape)

for t in  [0, 1, 2, 3, 4, 5, 6, 7, 8, 9]:
    fig = plt.figure(figsize=(5, 2))
    h = 0
    k = 0
    while h < 30:
        if Y_pred_classes[k] == t:
            fig.add_subplot(3, 10, h+1)
            plt.title(f"True {Y_true[k]} \n Pred {Y_pred_classes[k]}", fontsize = 8)
            plt.xticks([])
            plt.yticks([])
            sns.despine(top=True, right=True, left=True, bottom=True)
            plt.imshow(X_val2[k], cmap='binary')
            k += 1
            h += 1
        else:
            k += 1
    plt.show()
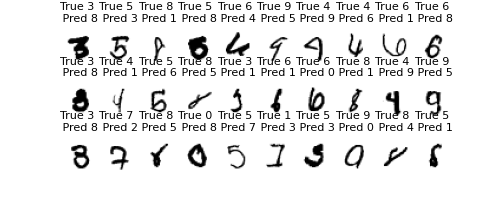
間違った数字を30個取り出してみる
fig = plt.figure(figsize=(5, 2))
h = 0
k = 0
while h < 30:
    if Y_pred_classes[k] != Y_true[k]:
        fig.add_subplot(3, 10, h+1)
        plt.title(f"True {Y_true[k]} \n Pred {Y_pred_classes[k]}", fontsize = 8)
        plt.xticks([])
        plt.yticks([])
        sns.despine(top=True, right=True, left=True, bottom=True)
        plt.imshow(X_val2[k], cmap='binary')
        k += 1
        h += 1
    else:
        k += 1
plt.show()
◎学習率=1e-5の時の結果
正誤状況をヒートマップで確認
◎学習率=1e-7の時の結果
正誤状況をヒートマップで確認
各数字30個取り出して正誤を見てみる
2.2.Seqentialモデルを作ってみるパート2!!!!!
model2 = Sequential()

model2.add(Conv2D(filters = 20, kernel_size = (5, 5), padding = 'Same', activation ='relu', input_shape = (28,28,1)))
model2.add(MaxPooling2D(pool_size=(2, 2)))

model2.add(Conv2D(filters = 50, kernel_size = (5, 5), padding = 'Same', activation ='relu'))
model2.add(MaxPooling2D(pool_size=(2, 2)))

model2.add(Conv2D(500,kernel_size =  (4, 4),padding = 'Same', activation ='relu'))
model2.add(Conv2D(10,kernel_size =  (1, 1),padding = 'Same', activation ='relu'))
model2.add(Flatten())
model2.add(Dense(500, activation = "relu"))
model2.add(Dense(10, activation = "softmax"))
2.2.1.RMSpropで最適化
#RMSpropで最適化
opt = keras.optimizers.RMSprop(lr=1e-3, rho=0.9, epsilon=1e-08, decay=0.0)
model2.compile(optimizer = opt, loss = "categorical_crossentropy", metrics=["accuracy"])
history = model2.fit(X_train, Y_train, validation_split=0.25, epochs=3, batch_size=32, verbose=1)
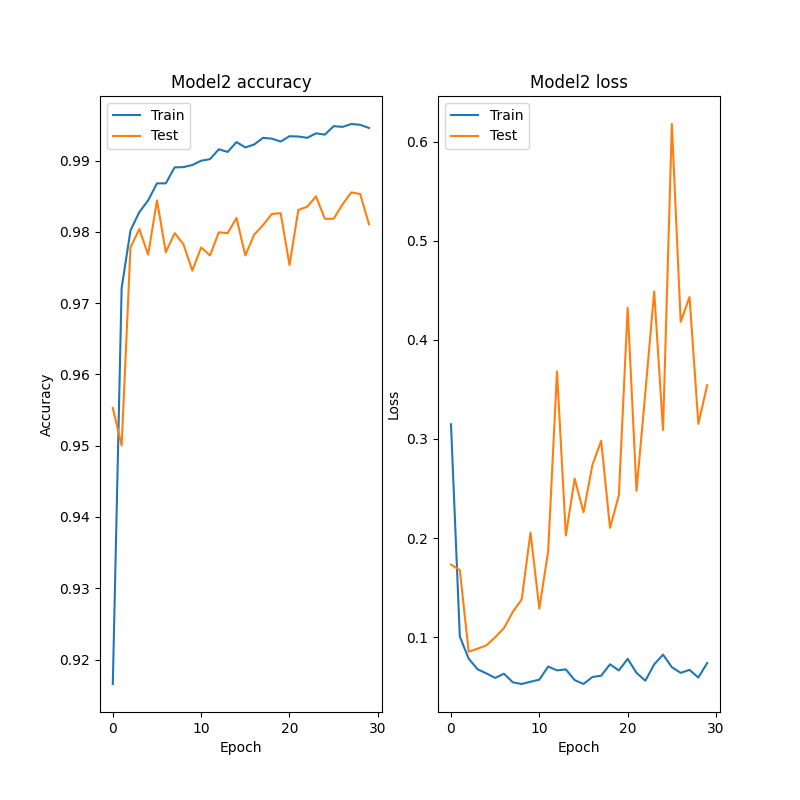
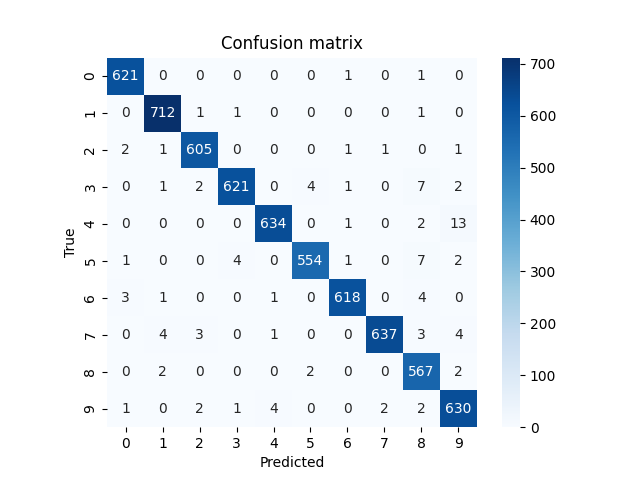
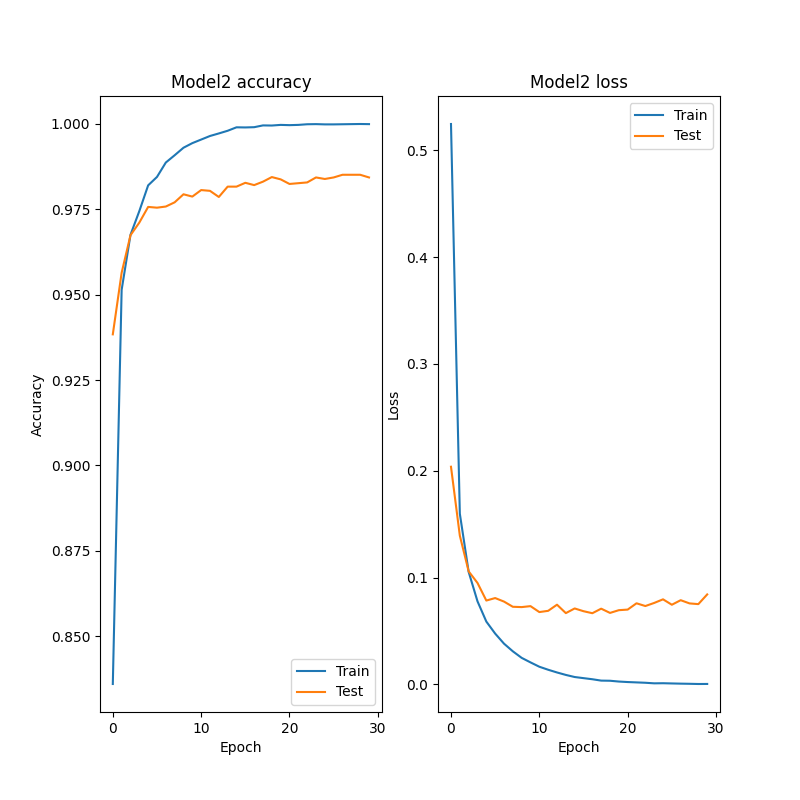
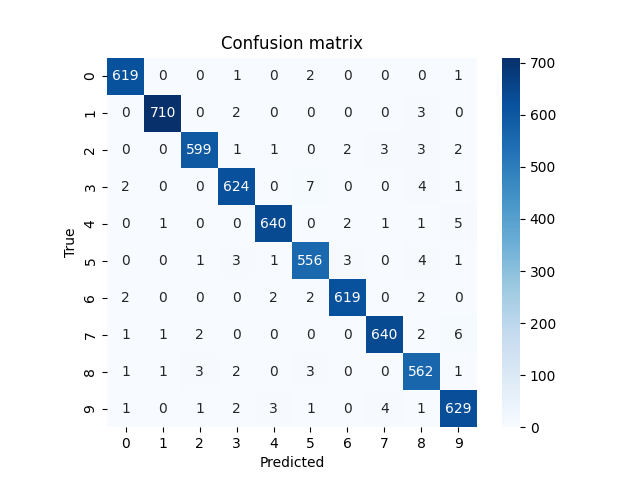
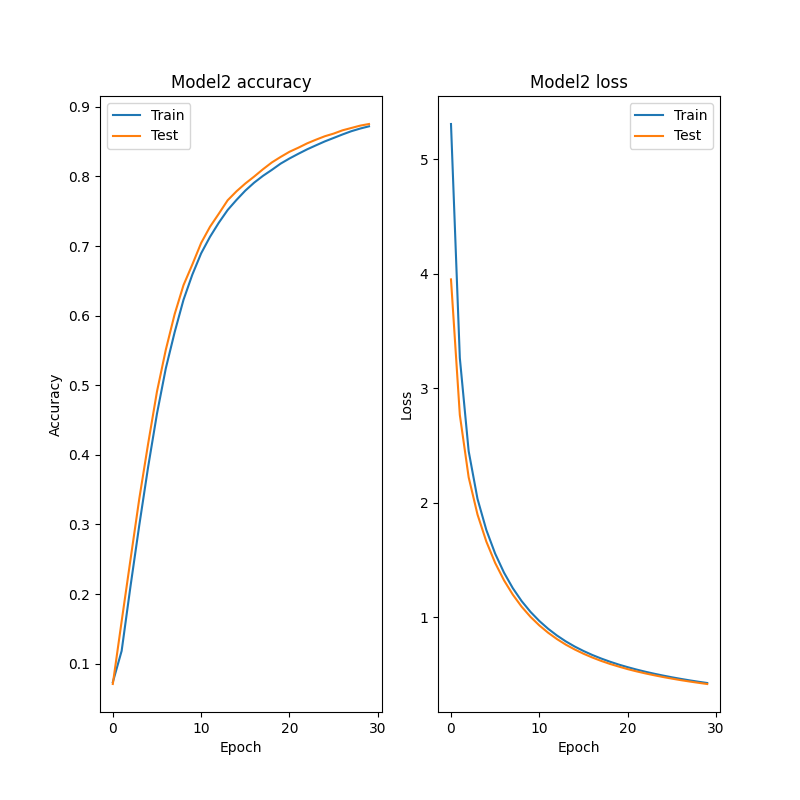
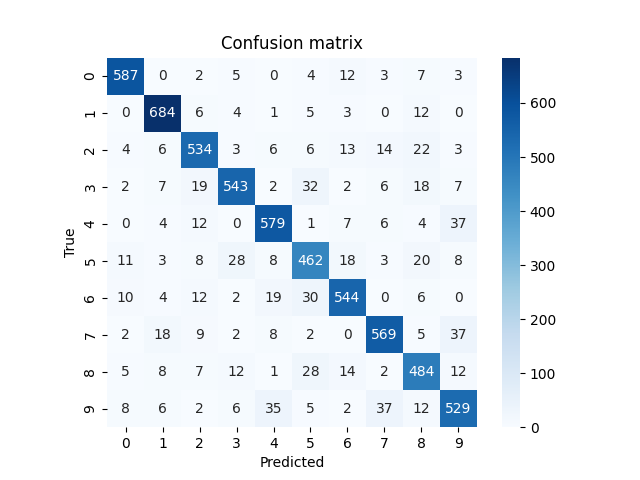
2.2.2.モデル2の損失と正確度、その時の正誤の様子を可視化
fig = plt.figure(figsize=(8, 8))
#ヒストリーの可視化(正確)
fig.add_subplot(1, 2, 1)
acc = history2.history['accuracy']
val_acc = history2.history['val_accuracy']
plt.plot(acc, label="Training accuracy")
plt.plot(val_acc,label="Validation accuracy")
plt.title('Model2 accuracy')
plt.ylabel('Accuracy')
plt.xlabel('Epoch')
plt.legend(['Train', 'Test'], loc='best')

#ヒストリーの可視化(損失)
fig.add_subplot(1, 2, 2)
loss = history2.history["loss"]
val_loss = history2.history["val_loss"]
plt.plot(loss, label="Training loss")
plt.plot(val_loss, label="validation loss")
plt.title('Model2 loss')
plt.ylabel('Loss')
plt.xlabel('Epoch')
plt.legend(['Train', 'Test'], loc='best')
plt.show()

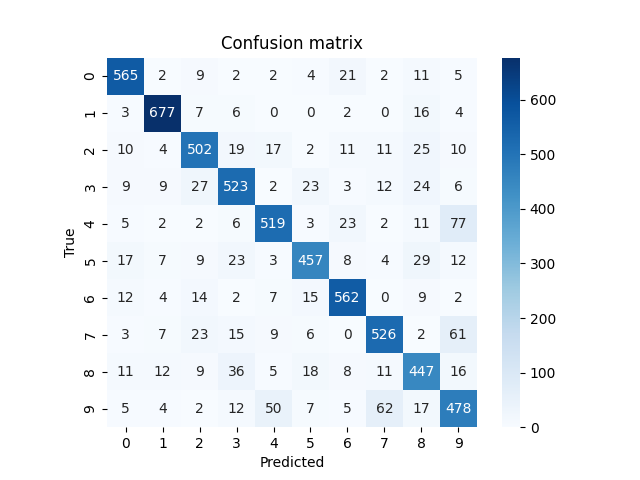
#ヒートマップで確認
from sklearn.metrics import confusion_matrix
from decimal import Decimal
Y_pred = model2.predict(X_val)
Y_pred_classes = np.argmax(Y_pred, axis = 1)
Y_true = np.argmax(Y_val, axis = 1)
cm = confusion_matrix(Y_true, Y_pred_classes)
sns.heatmap(cm, square=True, cbar=True, annot=True, cmap='Blues', fmt='.0f')
plt.title('Confusion matrix')
plt.xlabel("Predicted")
plt.ylabel("True")
plt.show()
