はじめに
統計分布と戯れたシリーズ第二段ということで二項分布をお届けする。
二項分布とは
- 成功確率pのベルヌーイ試行をn回行った時の和が従う分布を二項分布という。
- 書き方 Bin(n, p)
- 確率関数
$$ P(X=x) = {}_n C_x p^x (1-p)^{n-x} $$ - 平均 np
- 分散 np(1-p)
確率関数を書いてみよう
# 二項分布の確率関数
def binomial(x, n, p):
    ret = (math.factorial(n) / (math.factorial(x) * math.factorial(n-x))) * np.power(p, x) * np.power(1-p, n-x)
    return ret
確率関数を描画してみよう
定義した確率関数を使って、$Bin(10, 0.3)$ に従う二項分布を描画してみる。
# X~B(10, 0.3)
xs = []
ys = []
for x in range(10+1):
    xs.append(x)
    ys.append(binomial(x, 10, 0.3))

fig = plt.figure(figsize=(8,5))
ax = fig.add_subplot(1,1,1)
ax.bar(xs, ys)
こんな感じ。
なお、scipyでやるとこんな感じだ。検算するとよいだろう。
# Scipyの確率関数で検算する
from scipy.stats import binom
rv = binom(10, 0.3)
ys_scipy = rv.pmf(xs)

fig = plt.figure(figsize=(8,5))
ax = fig.add_subplot(1,1,1)
ax.bar(xs, ys_scipy)
再生性を確認しよう
$X1~Bin(n1, p), X2~Bin(n2, p) $である時、$X1 + X2~Bin(n1+n2, p)$ となることが知られている。これを二項分布の再生性という。
そこで、$X1~B(10, 0.4), X2~B(20, 0.4)$ に従う $X1, X2$ の和が、$Bin(30, 0.4)$ に従うかやってみよう。
まずは、$X1+X2$ の分布を求めてみる。
x1s = []
y1s = []
x2s = []
y2s = []
n1 = 10
n2 = 20
p = 0.4

# X1~B(10, 0.4)
for x in range(n1+1):
    x1s.append(x)
    y1s.append(binomial(x, n1, p))

# X2~B(20, 0.4)
for x in range(n2+1):
    x2s.append(x)
    y2s.append(binomial(x, n2, p))

# 10000回X1, X2のサンプルを取得し、X1+X2の分布(出現回数)を取得する
sample_size = 10000
x1_x2 = [0] * (n1 + n2 + 1)
for i in range(sample_size):
    # X1から1つサンプルを取得
    x1_sample = np.random.choice(x1s, p=y1s)
    # X2から1つサンプルを取得
    x2_sample = np.random.choice(x2s, p=y2s)
    # 和を求め当該値の出現回数をカウントアップ
    x1_x2[x1_sample + x2_sample] += 1

# 分布(出現回数) を標本数で割って確率を求める
x1_x2 = np.array(x1_x2)
x1_x2 = x1_x2/sample_size
次に $Bin(30, 0.4)$ を求めよう。
xs = []
ys = []
for x in range(30+1):
    xs.append(x)
    ys.append(binomial(x, 30, 0.4))
$X1+X2$ の分布と $Bin(30, 0.4)$ の分布を重ねてみよう
fig = plt.figure(figsize=(8,5))
ax = fig.add_subplot(1,1,1)
# X1+X2の分布
ax.bar(range(n1+n2+1), x1_x2, color="r", alpha=0.3)
# Bin(30, 0.4)の分布
ax.bar(xs, ys, color="b", alpha=0.3)
紫の色のところが重ねなった部分になるが、ほぼ重なっていることが分かる。

中心極限定理を確認しよう
中心極限定理とは、平均u、分散 $σ^{2}$の独立同一分布に従う確率変数 $X_{1},X{2} ,,,X_{n}$ に対し、その標本平均を $\bar{X_{n}}$ と表した時、$\sqrt{n}(\bar{X_{n}}-u)$ が、正規分布$N(0,σ^{2})$ に分布収束するというものである。
二項分布 $Bin(N, p)$ は、平均 $Np$、分散 $Np(1-p)$ であったから、この定義に従うと $\sqrt{n}(\bar{X_{n}}-Np)$は、正規分布$N(0,Np(1-p))$ に分布収束する。
$N = 10, p =0.4, n=100 $ の条件でやってみよう。
# X~B(10, 0.4)の確率関数によるサンプリングの準備
N = 10
p = 0.4
n = 100
x1s = []
y1s = []
for x in range(N+1):
    x1s.append(x)
    y1s.append(binomial(x, N, p))

# 標本数n標本平均を求め、統計量を計算することを1000回繰り返す
traial_time = 10000
targets = []

for i in range(traial_time):
    x1_samples = []
    # n=100サンプリングする
    for j in range(n):
        x1_sample = np.random.choice(x1s, p=y1s)
        x1_samples.append(x1_sample)

    # n=100の標本平均を求める
    x1_samples_mean = np.array(x1_samples).mean()

    # 統計量を計算する
    target = math.sqrt(n) * (x1_samples_mean- N*p)
    targets.append(target)

# 統計量の1000回分の出現頻度をヒストグラムで描画する
fig = plt.figure(figsize=(8,5))
ax = fig.add_subplot(1,1,1)
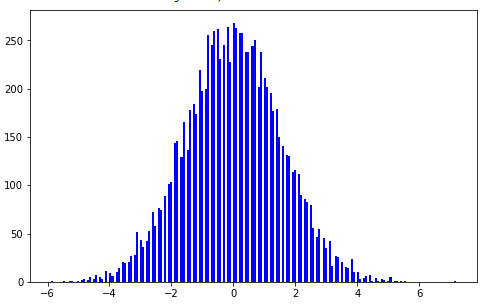
ax.hist(targets, bins=200, color="b")
そうすると以下のような分布が得られる。
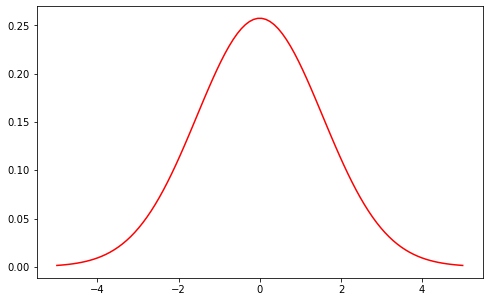
これが正規分布 $N(0,Np(1-p))$ に収束するということだから、これもグラフを描いて比較してみよう。
normal というのは正規分布の確率密度関数である。
# 正規分布を表示
fig = plt.figure(figsize=(8,5))
ax = fig.add_subplot(1,1,1)
x = np.linspace(-5, 5, 100)
y = normal(x, 0, N * p * (1-p))
ax.plot(x, y, color="r")
上を実行すると下のようなグラフが得られる。
$\sqrt{n}(\bar{X_{n}}-u)$ の分布が下の正規分布に非常に近いということが分かる。


