コード#
import matplotlib.pyplot as plt
import numpy as np
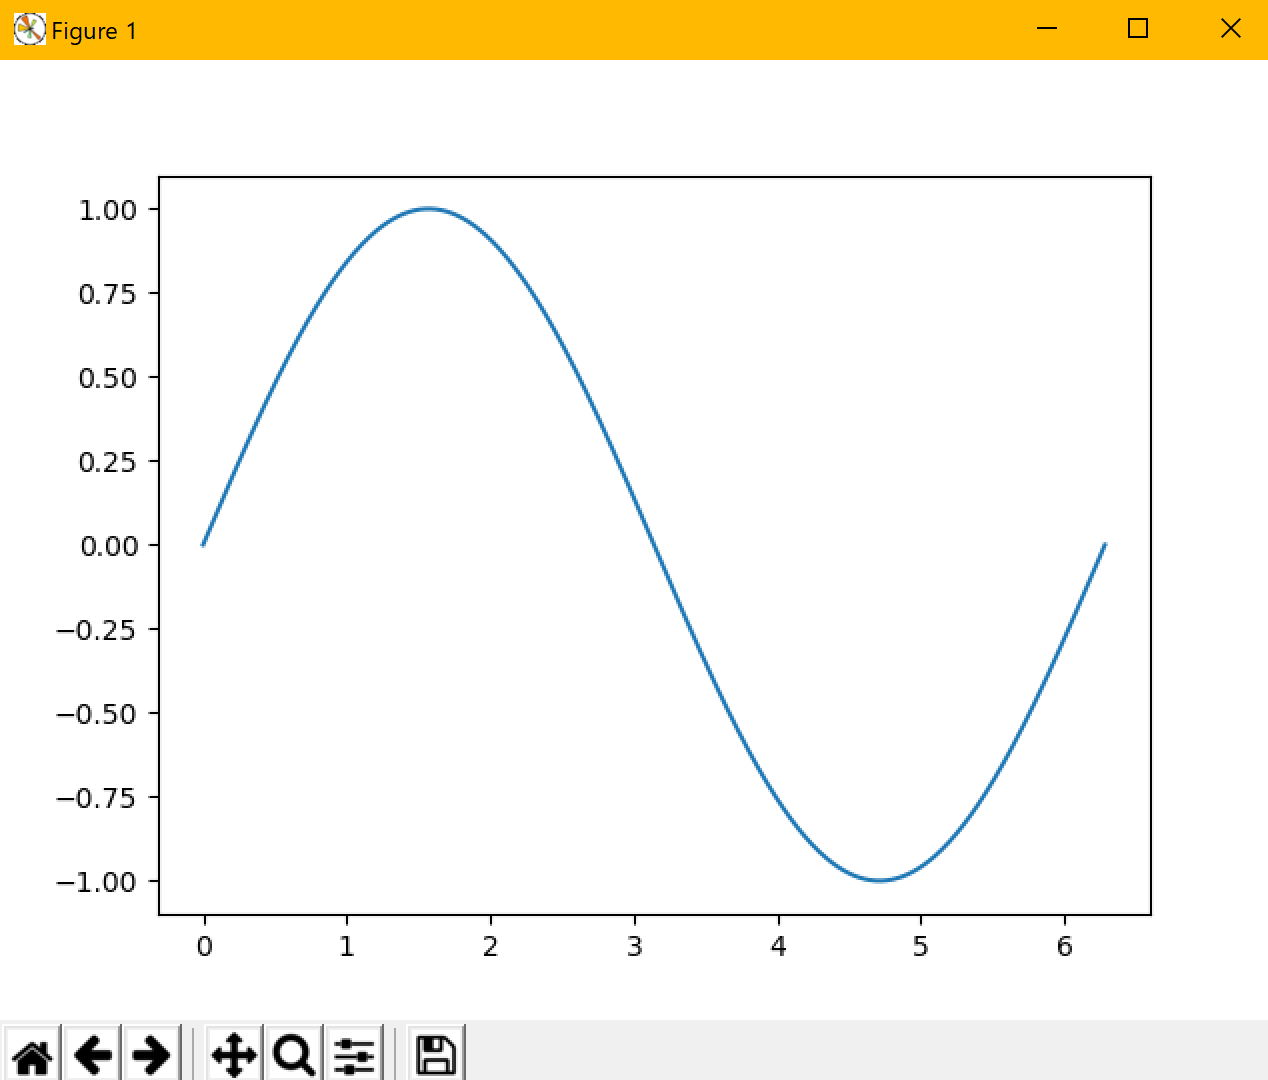
x = np.linspace(0, 2*np.pi, 500)
plt.plot(x,np.sin(x))
plt.show()
図#
説明##
必要なライブラリ##
| ライブラリ | 用途 |
|---|---|
| matplotlib | グラフを描画するために必要 |
| numpy | いろいろな計算をするのに必要 |
x軸の数値##
x = np.linspace(0, 2*np.pi, 500)
np.linspaceは等差数列を生成する関数です.
上記の例では, 0から2$\Pi$ の範囲で500個のnumpy配列を生成しています.
表示##
plt.plot(x,np.sin(x))
plt.show()
plt.plot(x,y)で表示したいデータをx,yに格納します.
今回はy=sin x を計算するためにnp.sin(x)をyのところに書いてますね.