AWS re:invent 2017でKinesis Firehose経由でのSplunkへのデータ投入ができるようになったと発表されました。
Amazon Kinesis Data Firehose、配信先として Splunk が一般利用可能に
CloudTrailやVPC Flow、CloudWatch Event、IoTをFirehose経由でストリームできるらしい。
ということで、試してみた。
はじめに
Splunk: バージョン7.0.2
OS: Amazon Linux on EC2
AWSユーザーアクティビティをモニタリングするには CloudTrail から証跡情報をとる必要があります。
データの流れは↓
CloudTrail --> CloudWatch Logs --> Kinesis Firehose --> Splunk
(参考)Power data ingestion into Splunk using Amazon Kinesis Data Firehose
Splunk設定
最初にデータの受け口となるSplunkをセットアップ
Appインストール
Splunk Add-on for Amazon Kinesis Firehose をSplunkにインストール
HTTP Event Collector設定
Firehose用のHECトークンを作成
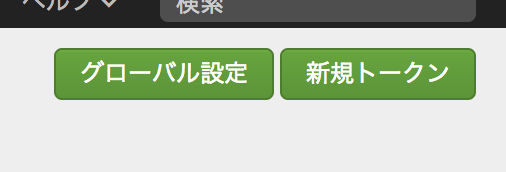
[設定] > [データ入力] から [HTTPイベントコレクタ] を選択
[新規トークン] をクリック
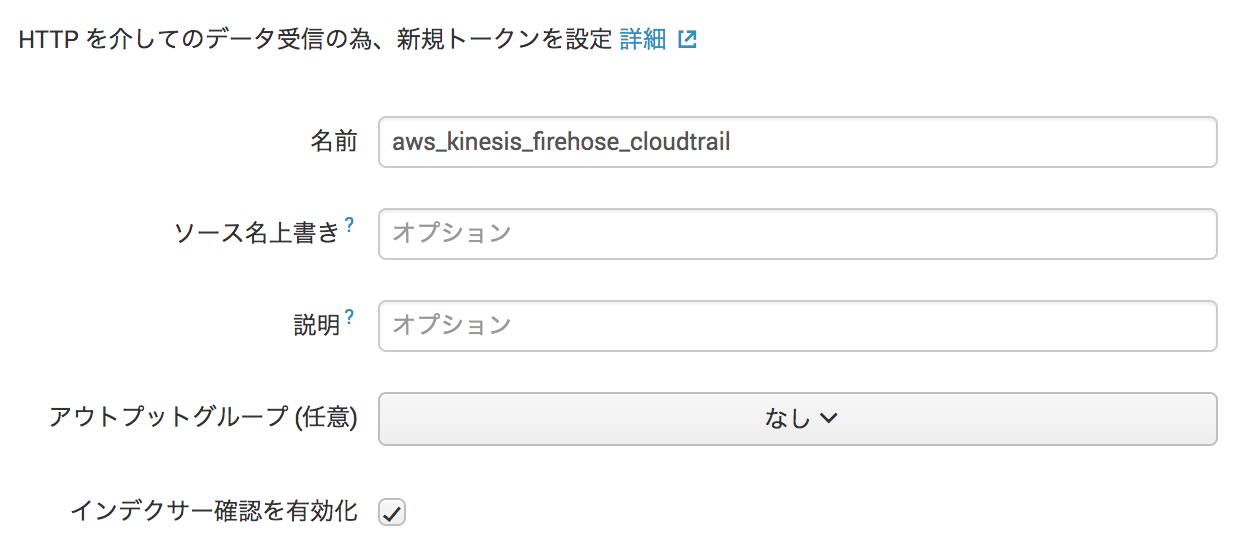
名前を入力して インデクサー確認を有効化 にチェック
HEC入力設定ごとにソースタイプを決めることになるので、CloudTrailからのデータとわかるよう aws_kinesis_firehose_cloudtrail と命名
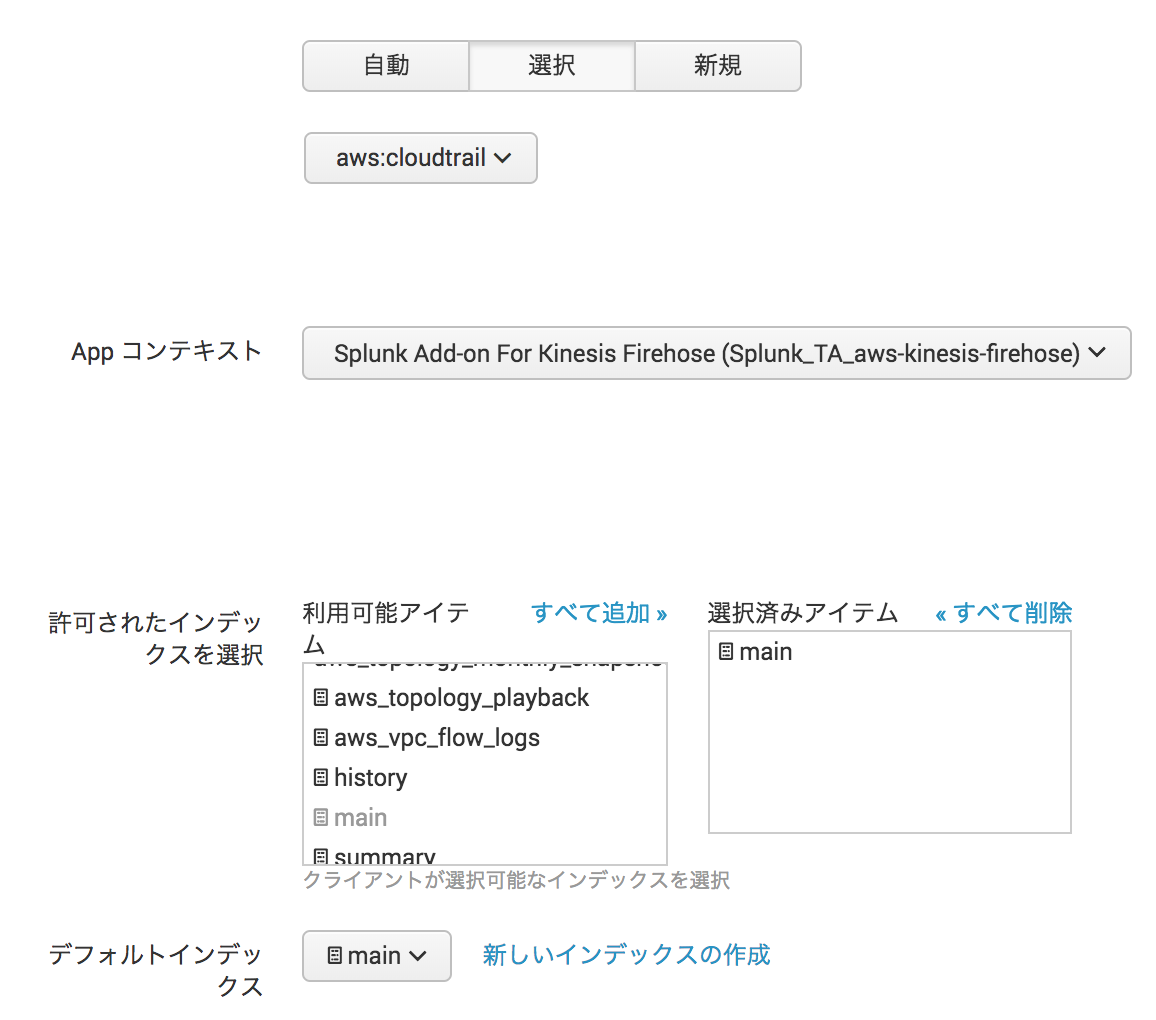
ソースタイプ を aws:cloudtrail に、 インデックス を main に設定
(データへのアクセス権を制御したい場合は個別にインデックスを作成)
そのまま次の画面で内容確認して問題なければ [実行]
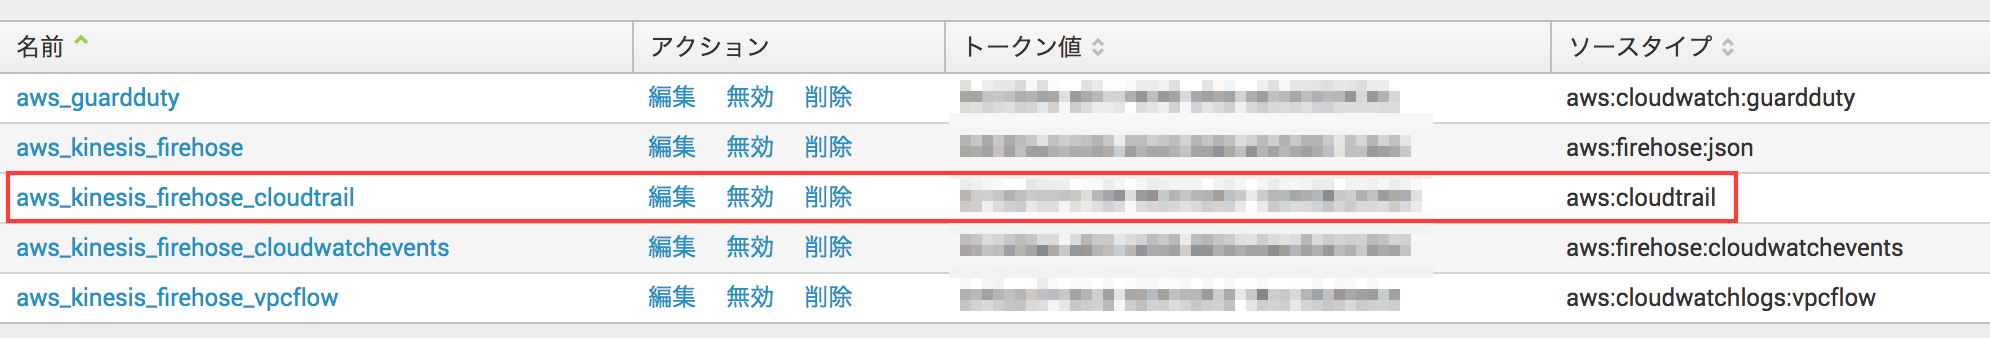
作成したHEC入力のトークン値を控えておく
SplunkのHTTPS設定
Amazon Kinesis Firehoseはデータ送信先のエンドポイントが商用のSSL証明書で暗号化されていることが必須要件となるらしい。
オレオレはダメみたい。
前回、Let's Encryptの証明書をSplunkにインストールしてみた ところ、FirehoseはLet's Encryptを認証してくれませんでした(2018年1月時点)。
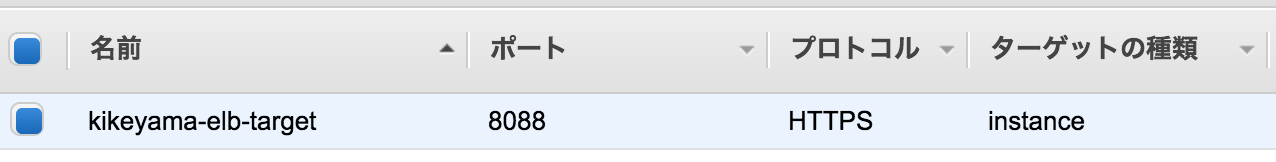
今回のSplunkインスタンスはEC2で稼働しているので、前段にELBを入れて、ACM (Amazon Certificate Manager) からAmazon署名の証明書を取得して対処しました。
ターゲットのEC2には、プロトコル HTTPS でポート 8088 に転送するようにしました。
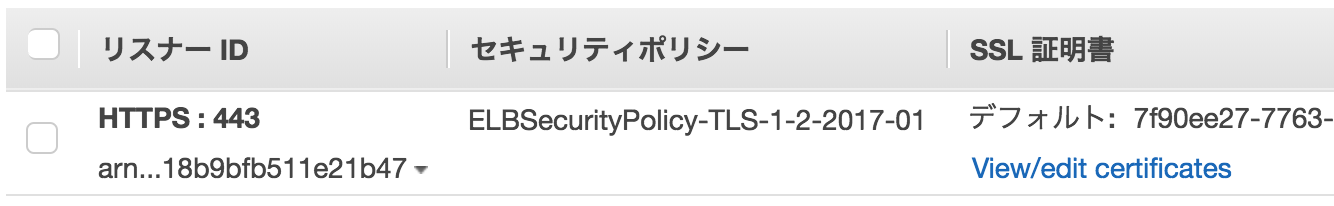
ELBが受ける通信は HTTPS ポート 443 で設定
これでSplunk側の設定は完了!
AWS設定
続いてAWS側の設定
Lambda, Firehose, CloudWatch Logs, CloudTrailの順に設定します。
Lambda設定
まずはLambdaから
なぜLambdaが必要かって?
なぜなら、CloudWatch Logsから送られるデータは圧縮されているので、それをFirehose経由で送ってもSplunkが受け取れないから、解凍する処理を経由させる必要があるんです。
ちなみに、解凍の処理を入れずにFirehoseからSplunkに流そうとすると、以下のような InvalidEncodingException エラーが出ます。
{"attemptsMade":0,"arrivalTimestamp":1517204317073,"errorCode":"InvalidEncodingException","errorMessage":"The data could not be decoded as UTF-8","attemptEndingTimestamp":25314598570688,"rawData":"...","EventId":null}
ということで、Lambdaで新しい関数を作成
設計図(Blueprint)から kinesis-firehose-cloudwatch-logs-processor を選択して新規作成
検索フィルタに firehose splunk と入力すると出てきます。
ソースコード
/*
For processing data sent to Firehose by Cloudwatch Logs subscription filters.

Cloudwatch Logs sends to Firehose records that look like this:

{
  "messageType": "DATA_MESSAGE",
  "owner": "123456789012",
  "logGroup": "log_group_name",
  "logStream": "log_stream_name",
  "subscriptionFilters": [
    "subscription_filter_name"
  ],
  "logEvents": [
    {
      "id": "01234567890123456789012345678901234567890123456789012345",
      "timestamp": 1510109208016,
      "message": "log message 1"
    },
    {
      "id": "01234567890123456789012345678901234567890123456789012345",
      "timestamp": 1510109208017,
      "message": "log message 2"
    }
    ...
  ]
}

The data is additionally compressed with GZIP.

The code below will:

1) Gunzip the data
2) Parse the json
3) Set the result to ProcessingFailed for any record whose messageType is not DATA_MESSAGE, thus redirecting them to the
   processing error output. Such records do not contain any log events. You can modify the code to set the result to
   Dropped instead to get rid of these records completely.
4) For records whose messageType is DATA_MESSAGE, extract the individual log events from the logEvents field, and pass
   each one to the transformLogEvent method. You can modify the transformLogEvent method to perform custom
   transformations on the log events.
5) Concatenate the result from (4) together and set the result as the data of the record returned to Firehose. Note that
   this step will not add any delimiters. Delimiters should be appended by the logic within the transformLogEvent
   method.
*/

'use strict';

const zlib = require('zlib');

/**
 * logEvent has this format:
 *
 * {
 *   "id": "01234567890123456789012345678901234567890123456789012345",
 *   "timestamp": 1510109208016,
 *   "message": "log message 1"
 * }
 *
 * The default implementation below just extracts the message and appends a newline to it.
 *
 * The result must be returned in a Promise.
 */
function transformLogEvent(logEvent) {
    return Promise.resolve(`${logEvent.message}\n`);
}

exports.handler = (event, context, callback) => {
    Promise.all(event.records.map(r => {
        const buffer = new Buffer(r.data, 'base64');
        const decompressed = zlib.gunzipSync(buffer);
        const data = JSON.parse(decompressed);
        if (data.messageType !== 'DATA_MESSAGE') {
            return Promise.resolve({
                recordId: r.recordId,
                result: 'ProcessingFailed',
            });
        } else {
            const promises = data.logEvents.map(transformLogEvent);
            return Promise.all(promises).then(transformed => {
                const payload = transformed.reduce((a, v) => a + v, '');
                const encoded = new Buffer(payload).toString('base64');
                return {
                    recordId: r.recordId,
                    result: 'Ok',
                    data: encoded,
                };
            });
        }
    })).then(recs => callback(null, { records: recs }));
};
Kinesis Firehose設定
続いてFirehose
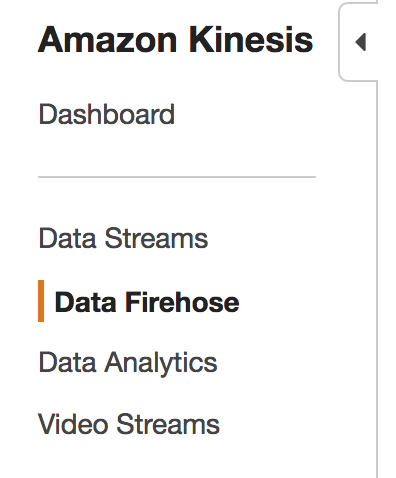
Kinesisの設定画面の左側メニューから Data Firehose を選択
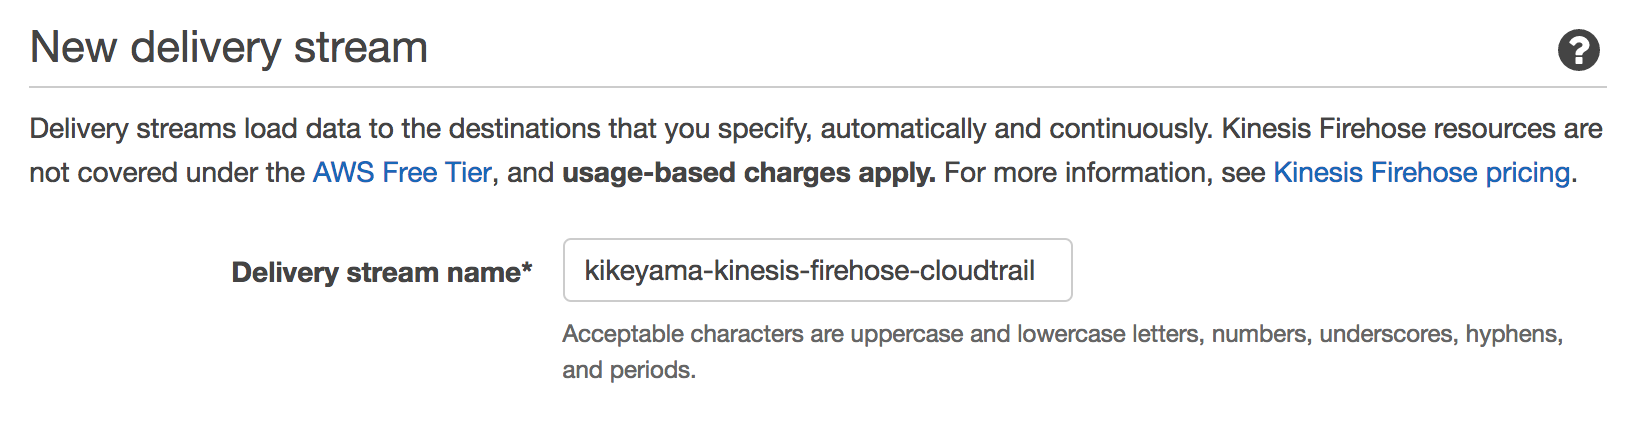
Create Delivery Stream をクリックして新しいストリームを作成
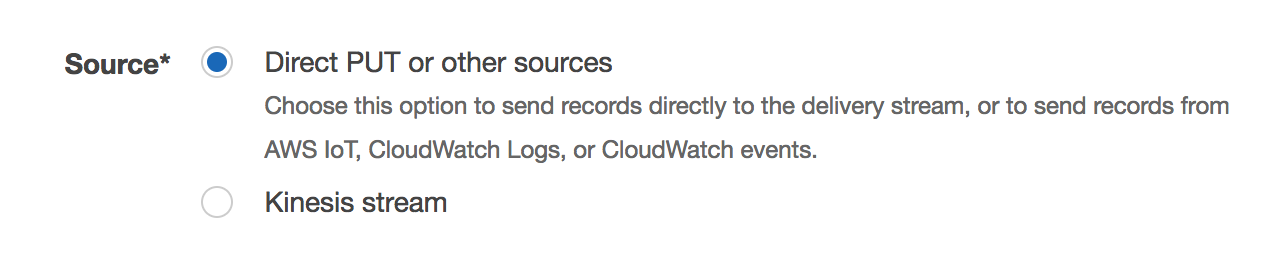
ストリーム名を入力して
Sourceは Direct PUT or other sources を選択
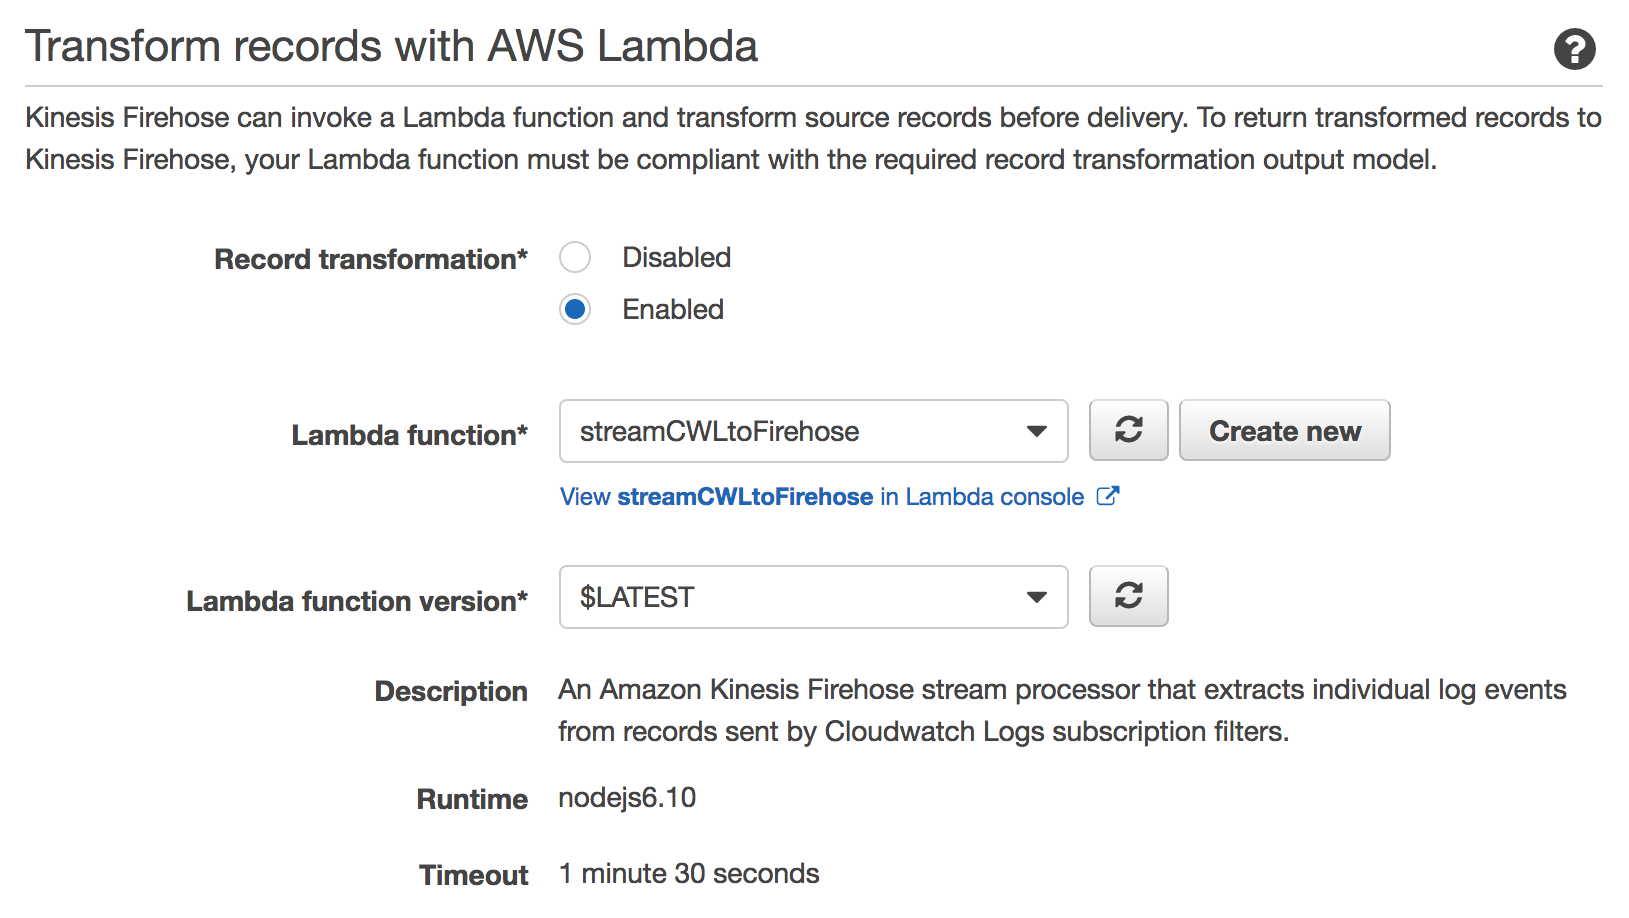
Transform records with AWS Lambda で作成した関数を指定
IAMロールのポリシーはデフォルトでおk
続いてデータ送信先を指定
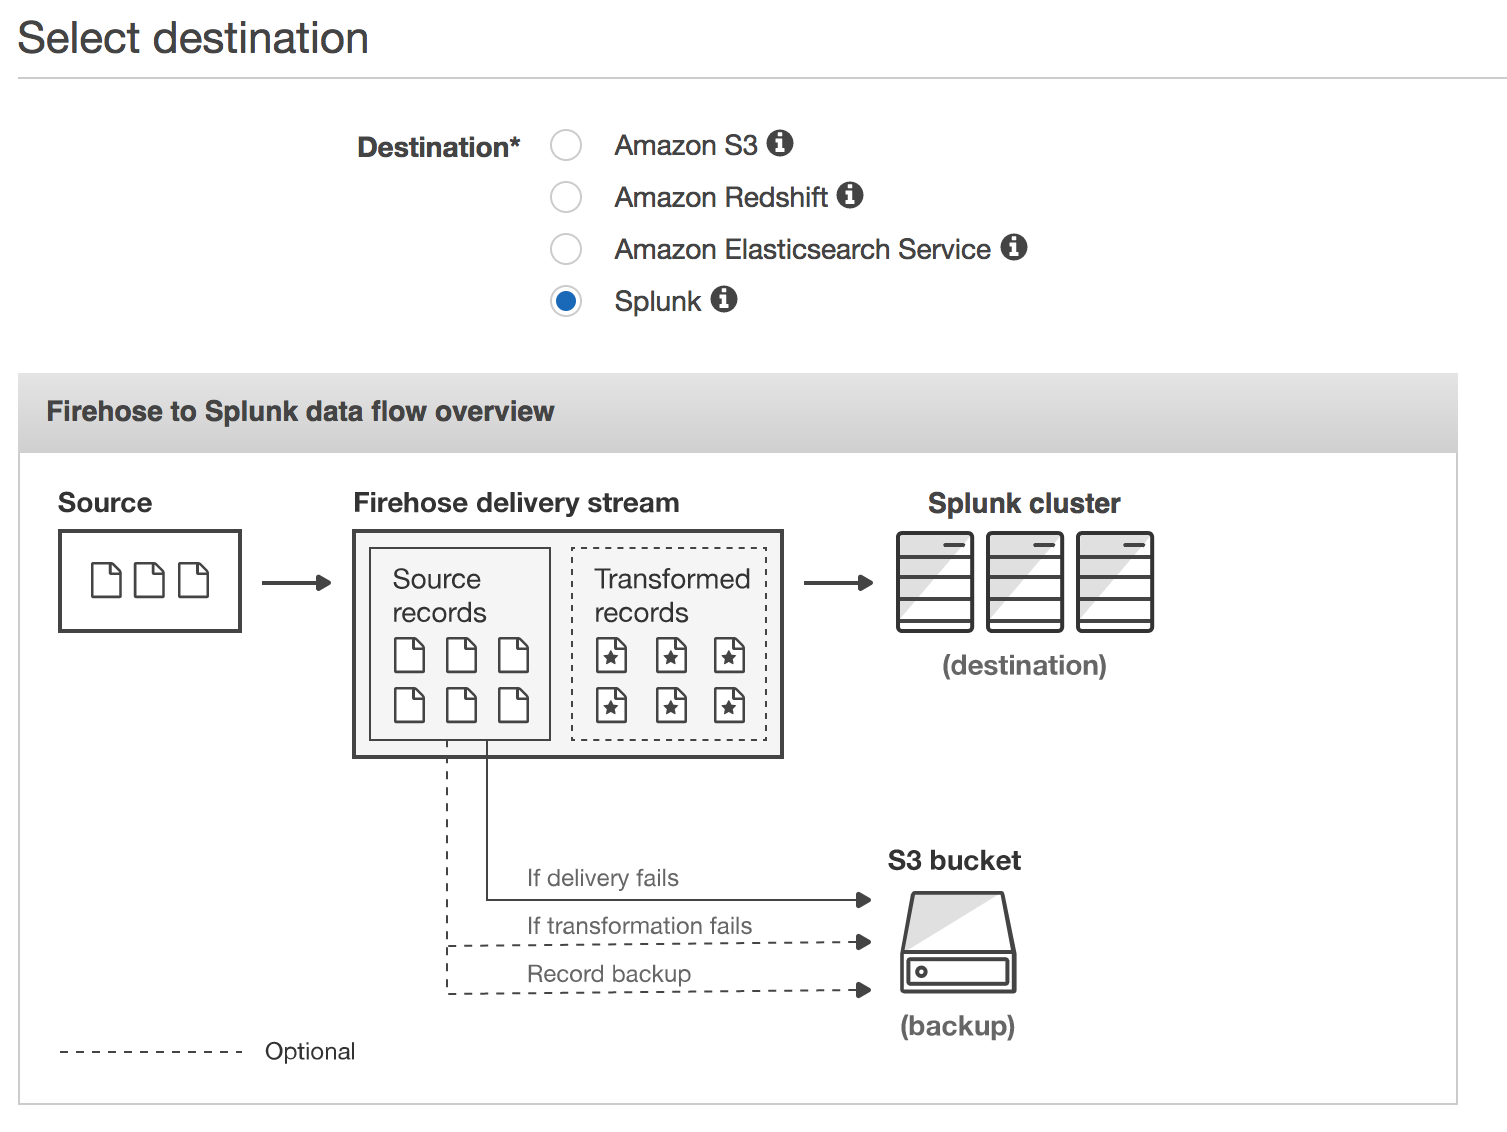
S3、Redshift、Elasticsearch とAWSのサービスと同列にサードパーティーの Splunkが並んでるのすごい!
で、 Splunkのエンドポイントとトークンを指定
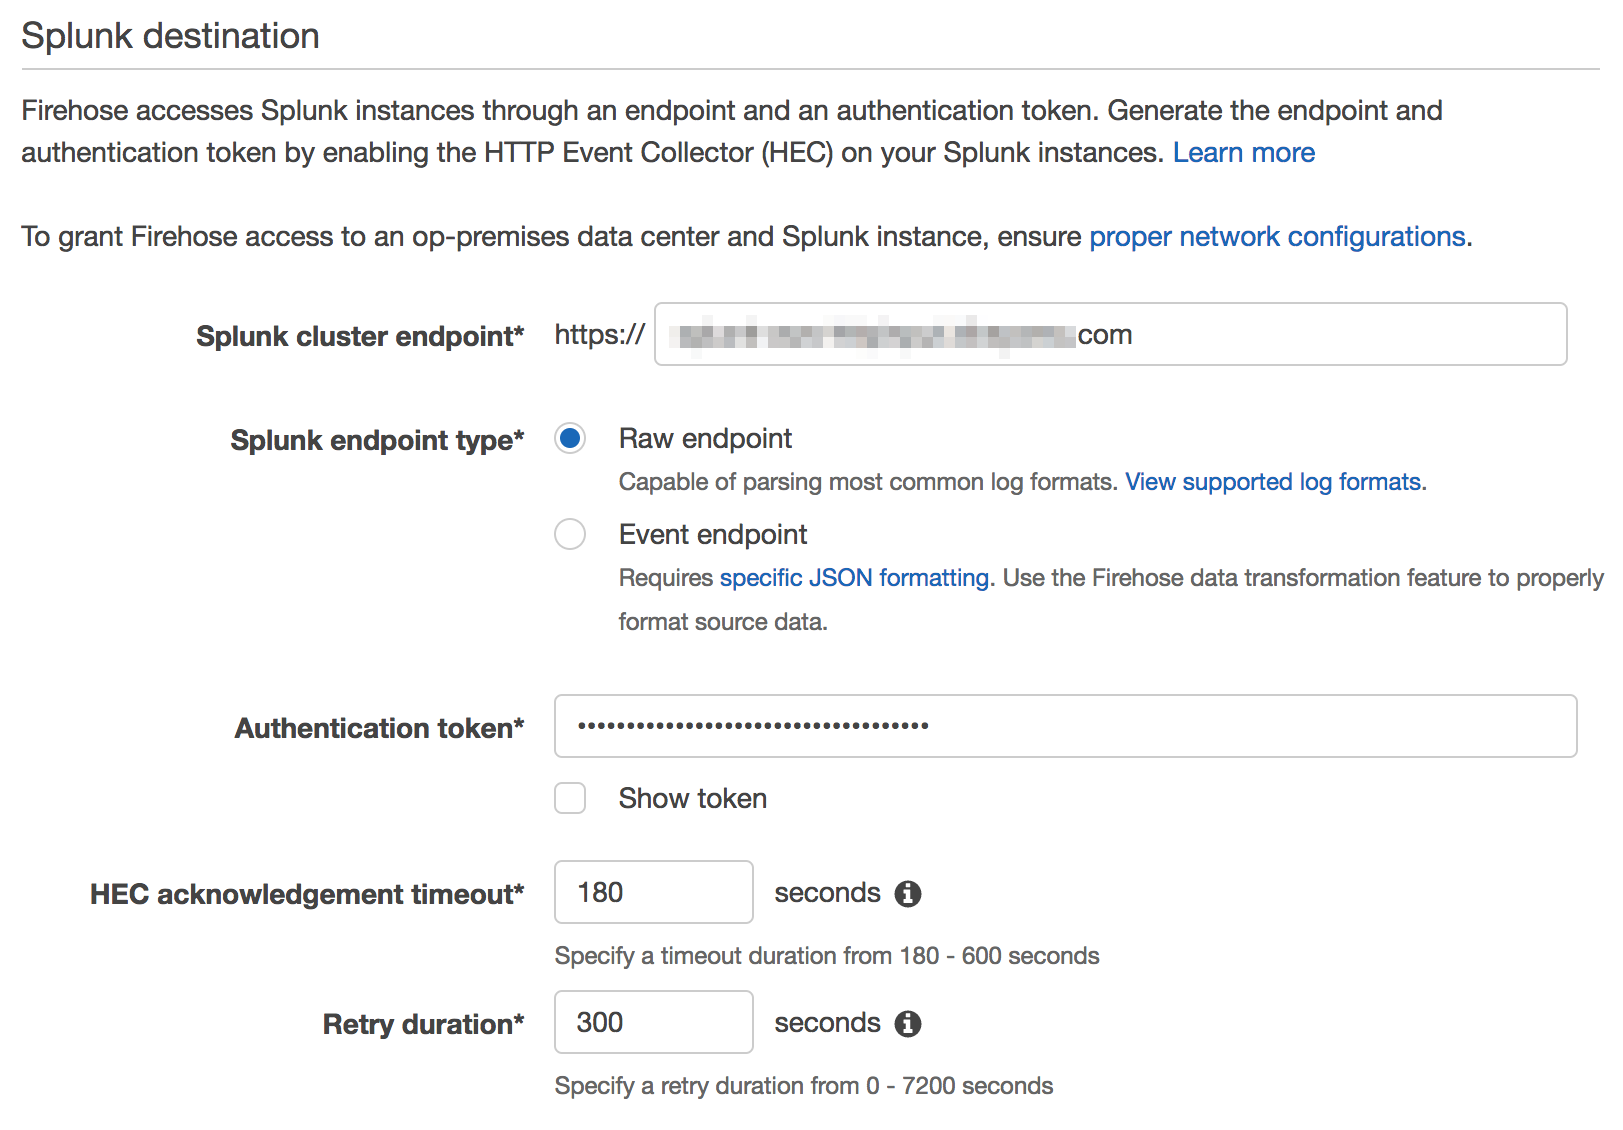
エンドポイントはELBで設定したFQDNを(ELB介さない場合はポート :8088 の指定が必要)、トークンは先のステップでSplunkで作成したトークンを指定
Splunk endpoint type は Raw endpoint を指定
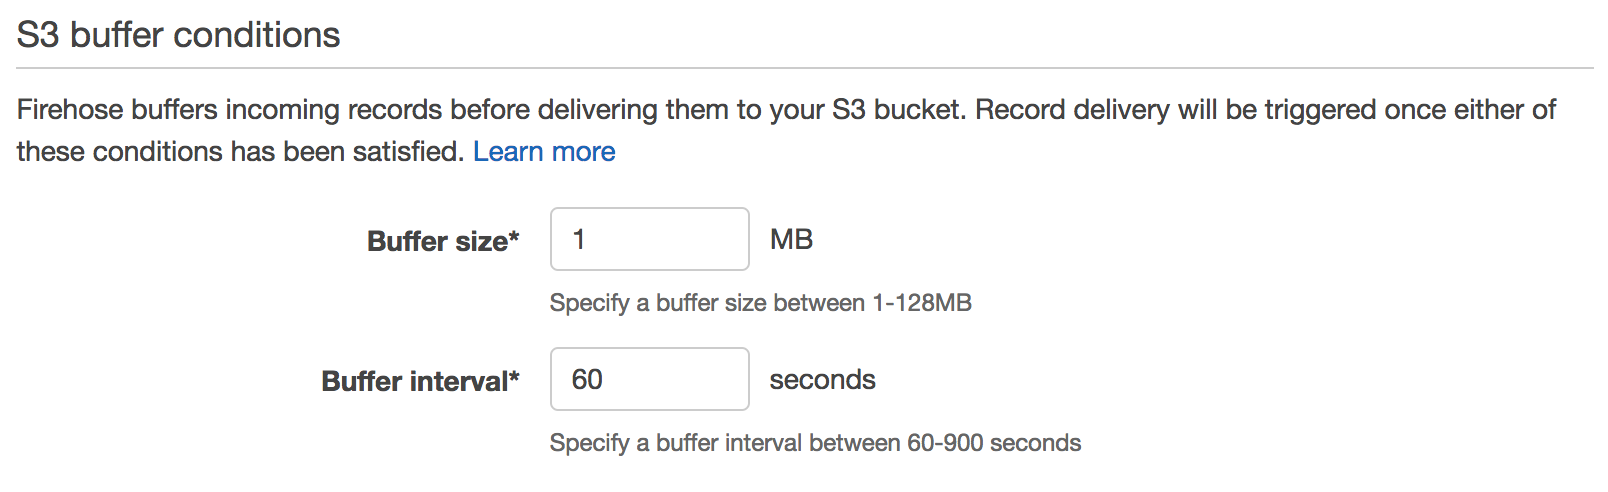
送信失敗した場合の転送先S3バケットは適当に
より早く送信してほしいので、バッファサイズと時間はなるべく小さくしてみた
内容確認して作成!
CloudWatch Logs設定
(参考) 例 3: Amazon Kinesis Data Firehose のサブスクリプションフィルタ
まずはCWLロググループをひとつ kikeyama/CloudTrail 作成
その後、SubscriptionでFirehoseに流す
aws logs put-subscription-filter \
    --log-group-name "kikeyama/CloudTrail" \
    --filter-name "Destination" \
    --filter-pattern "" \
    --destination-arn "arn:aws:firehose:us-west-2:123456789012:deliverystream/kikeyama-kinesis-firehose-cloudtrail" \
    --role-arn "arn:aws:iam::123456789012:role/CWLtoKinesisFirehoseRole"
--filter-pattern は必須のパラメータなので、何かしらのフィルタリングが必要。 "" 指定で全条件になるっぽい。
フィルタの指定方法 → CloudWatch Logs サブスクリプションフィルタの使用
フィルタでの絞り込みなしで全データ取り込みたい場合は、 --filter-pattern "" でいけるはず。
ちなみにIAMロールのポリシーは↓
{
    "Statement": [
        {
            "Effect": "Allow",
            "Action": [
                "firehose:*"
            ],
            "Resource": [
                "arn:aws:firehose:us-west-2:123456789012:*"
            ]
        },
        {
            "Effect": "Allow",
            "Action": [
                "iam:PassRole"
            ],
            "Resource": [
                "arn:aws:iam::123456789012:role/CWLtoKinesisFirehoseRole"
            ]
        }
    ]
}
-- 2018年2月27日追記 ココカラ --
ロールの信頼関係を編集して権限付与

{
  "Statement": {
    "Effect": "Allow",
    "Principal": { "Service": "logs.amazonaws.com" },
    "Action": "sts:AssumeRole"
  }
}
-- 2018年2月27日追記 ココマデ --
以上!
CloudTrail設定
最後に、CloudTrailを作ってオシマイ
CWLの設定に先ほど作ったロググループを指定
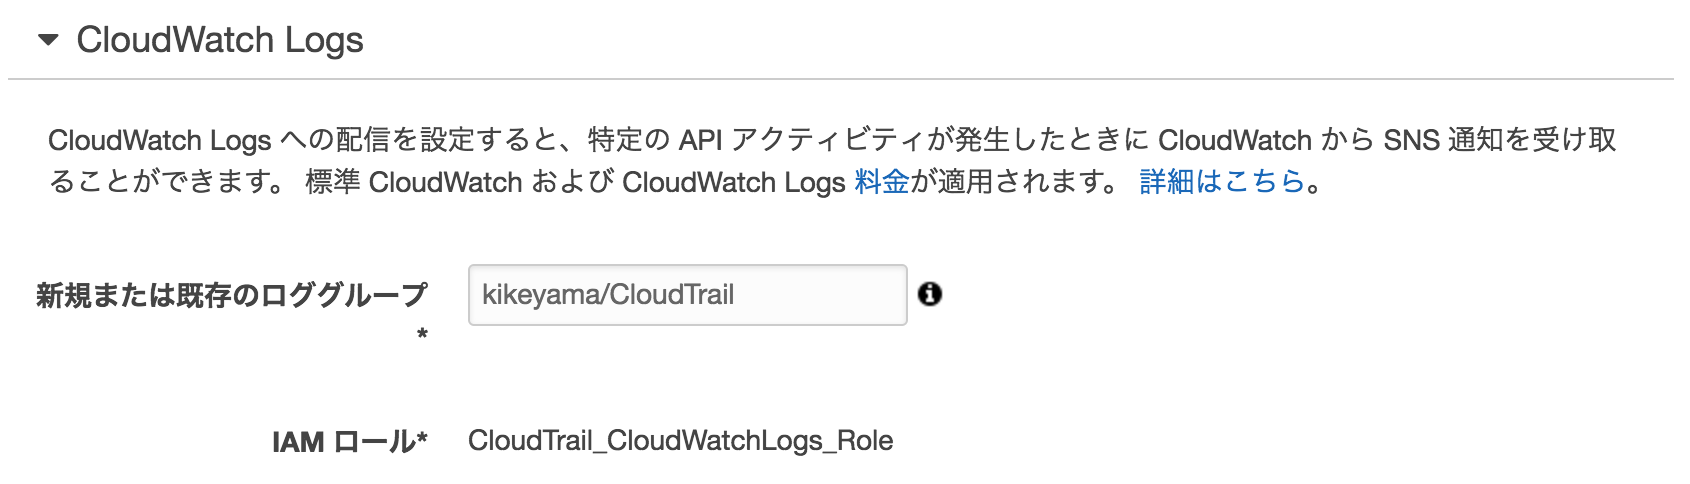
IAMは↓
{
  "Version": "2012-10-17",
  "Statement": [
    {
      "Sid": "AWSCloudTrailCreateLogStream20141101",
      "Effect": "Allow",
      "Action": [
        "logs:CreateLogStream"
      ],
      "Resource": [
        "arn:aws:logs:us-west-2:123456789012:log-group:kikeyama/CloudTrail:log-stream:123456789012_CloudTrail_us-west-2*"
      ]
    },
    {
      "Sid": "AWSCloudTrailPutLogEvents20141101",
      "Effect": "Allow",
      "Action": [
        "logs:PutLogEvents"
      ],
      "Resource": [
        "arn:aws:logs:us-west-2:123456789012:log-group:kikeyama/CloudTrail:log-stream:123456789012_CloudTrail_us-west-2*"
      ]
    }
  ]
}
Splunkでサーチ
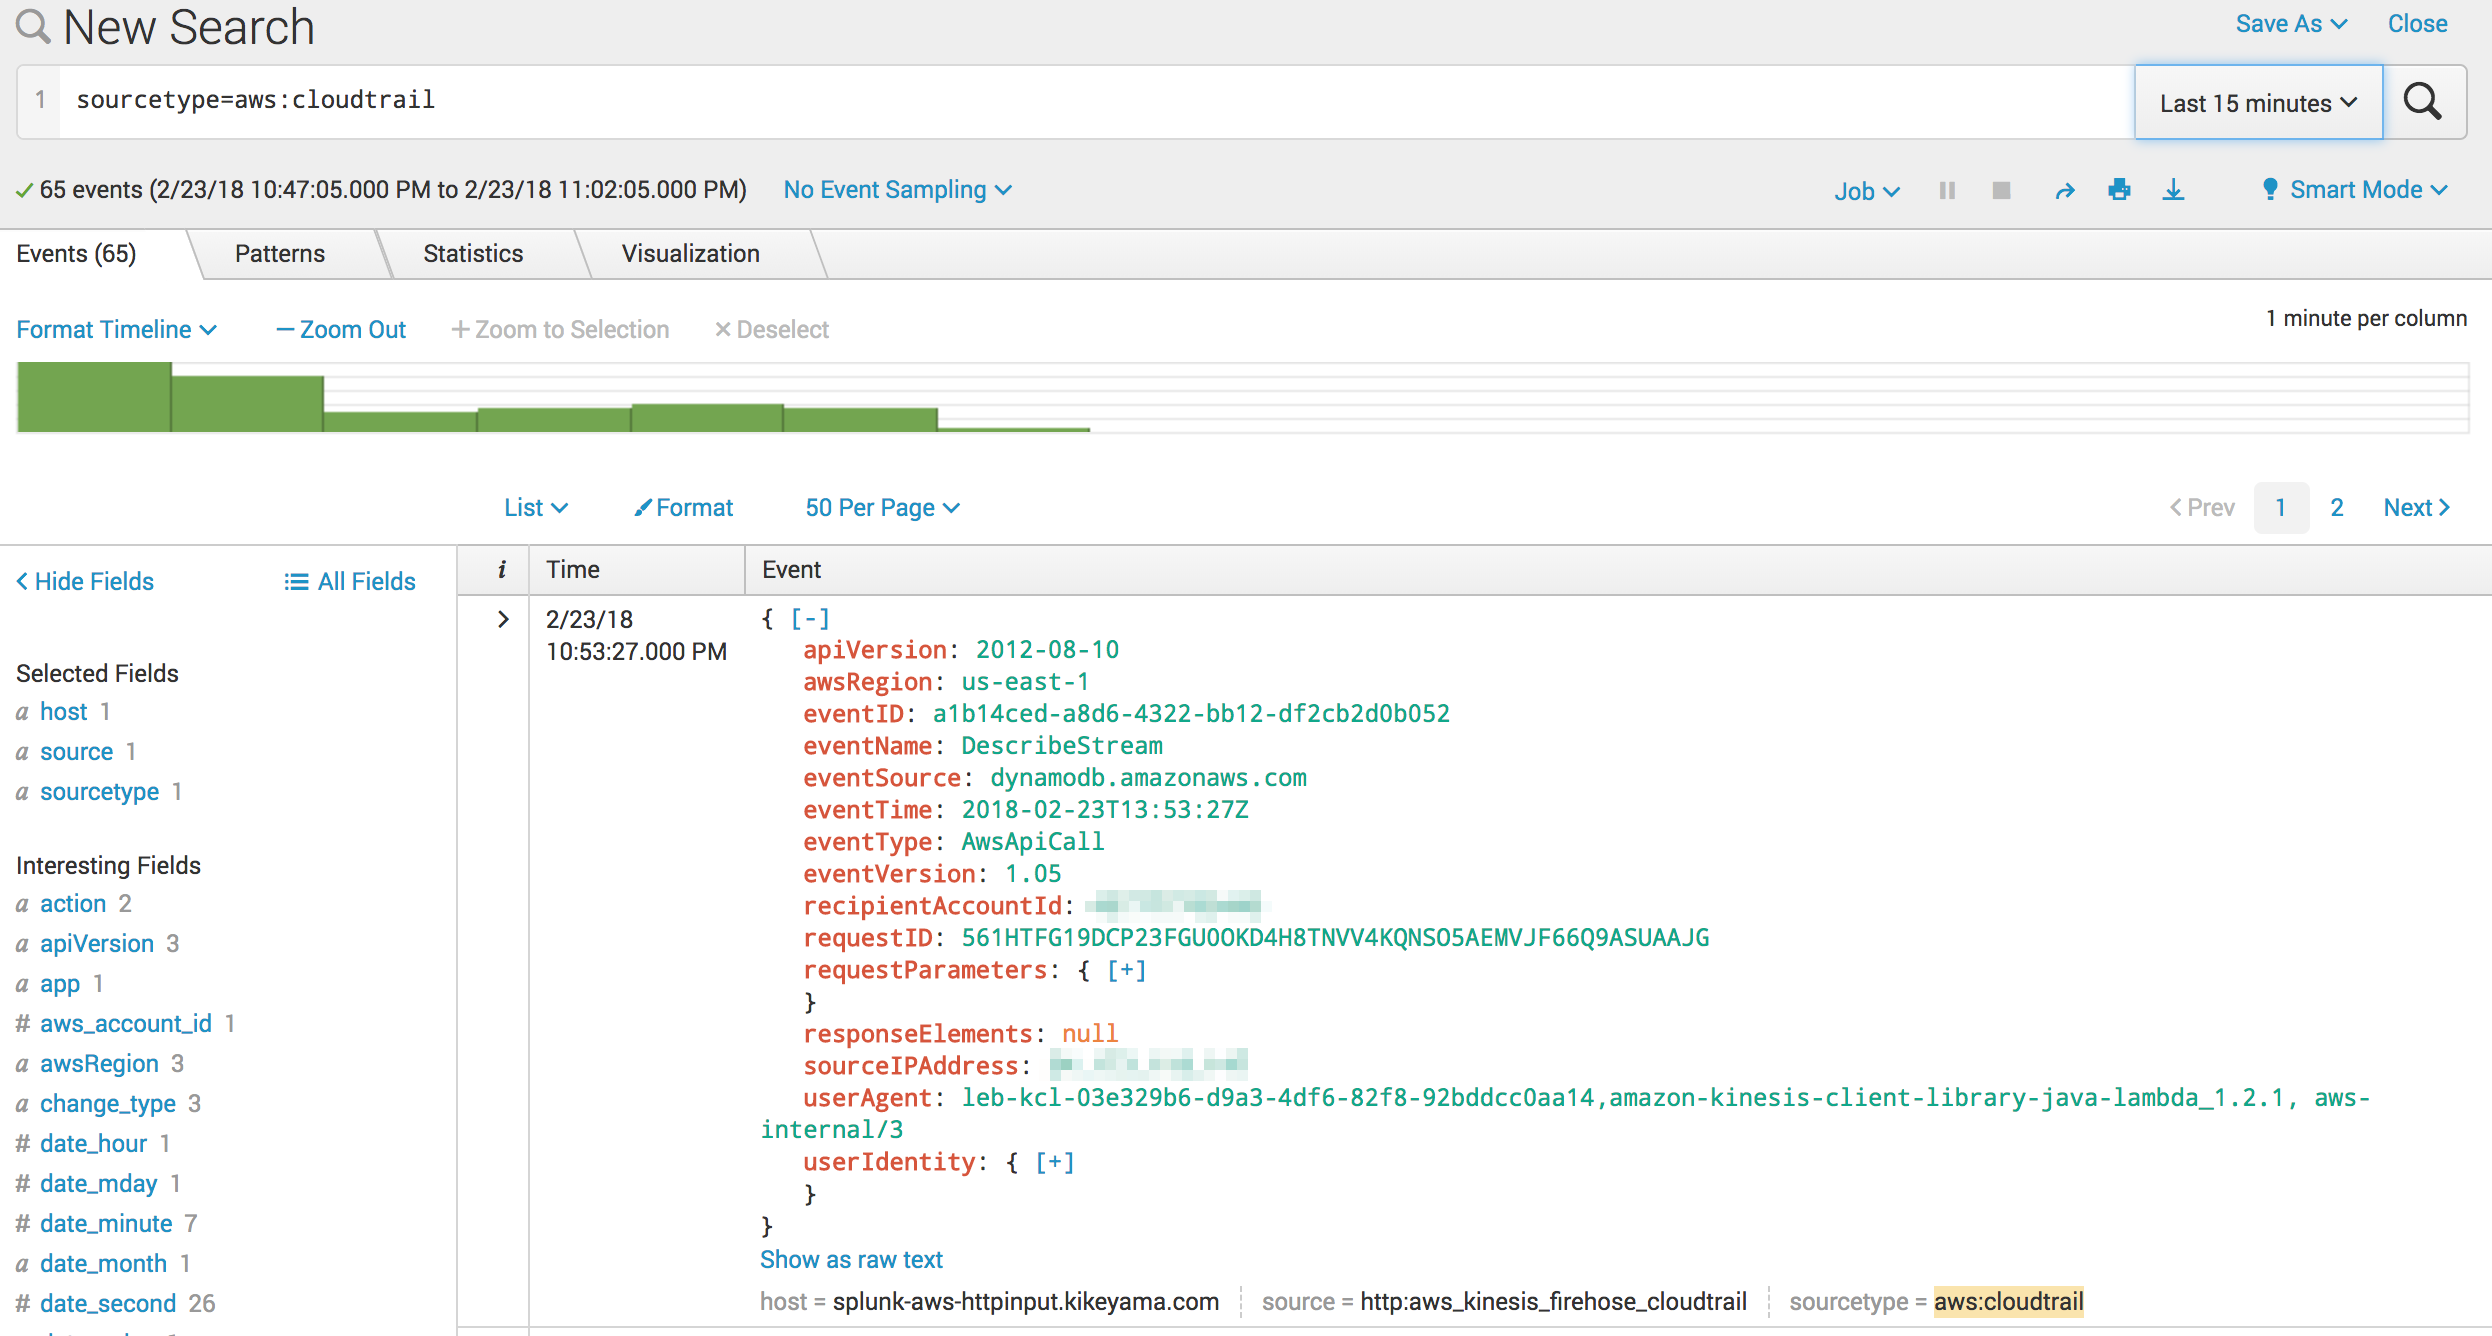
いいねー、データ入ってきてるねー
ユーザーアクティビティを可視化
可視化には Splunk App for AWS を使います。
SplunkにこのAppをインストールして、Appのメニューから Security > User Activity に進むと、、、
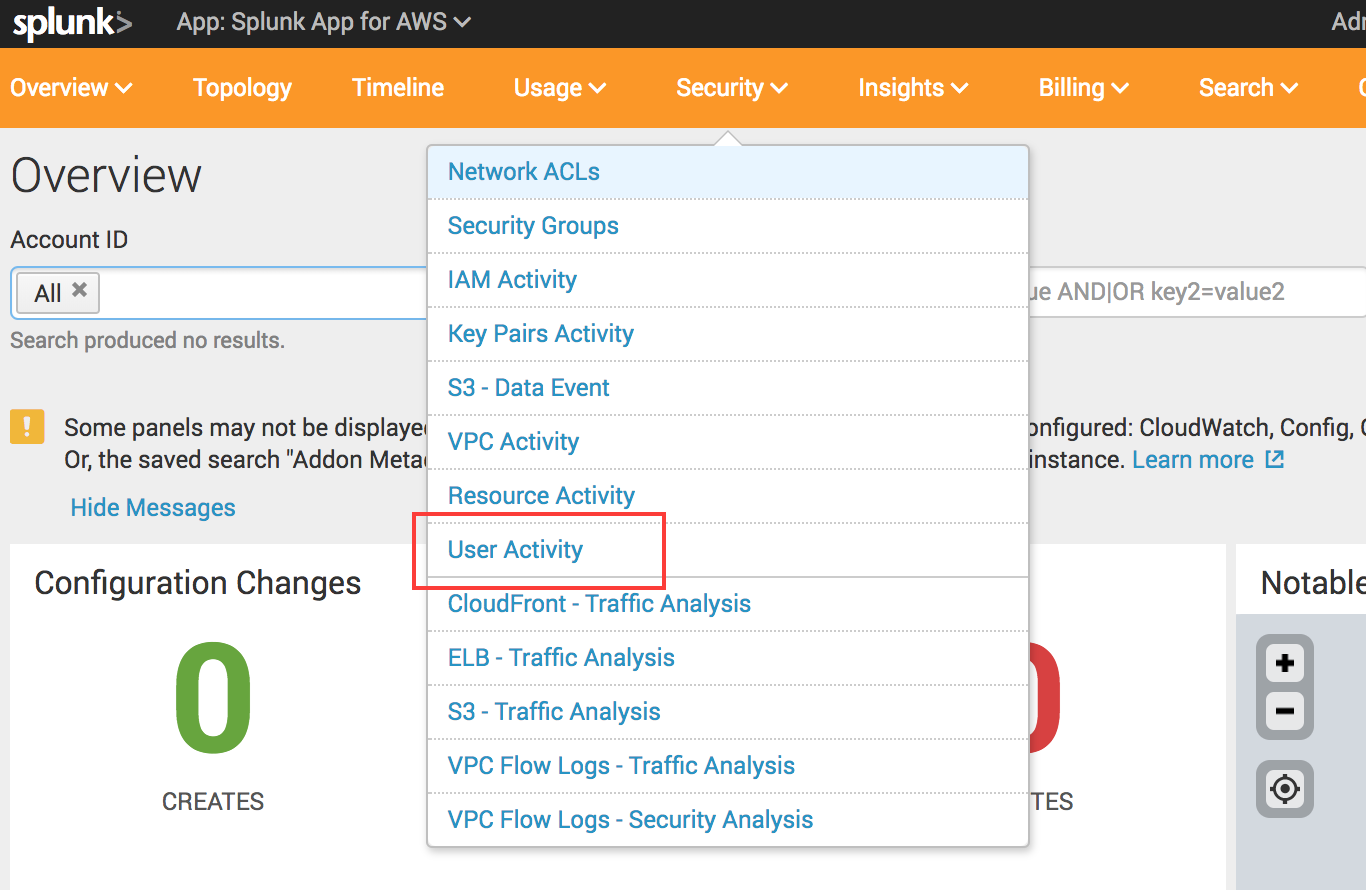
↓↓↓
おっ!
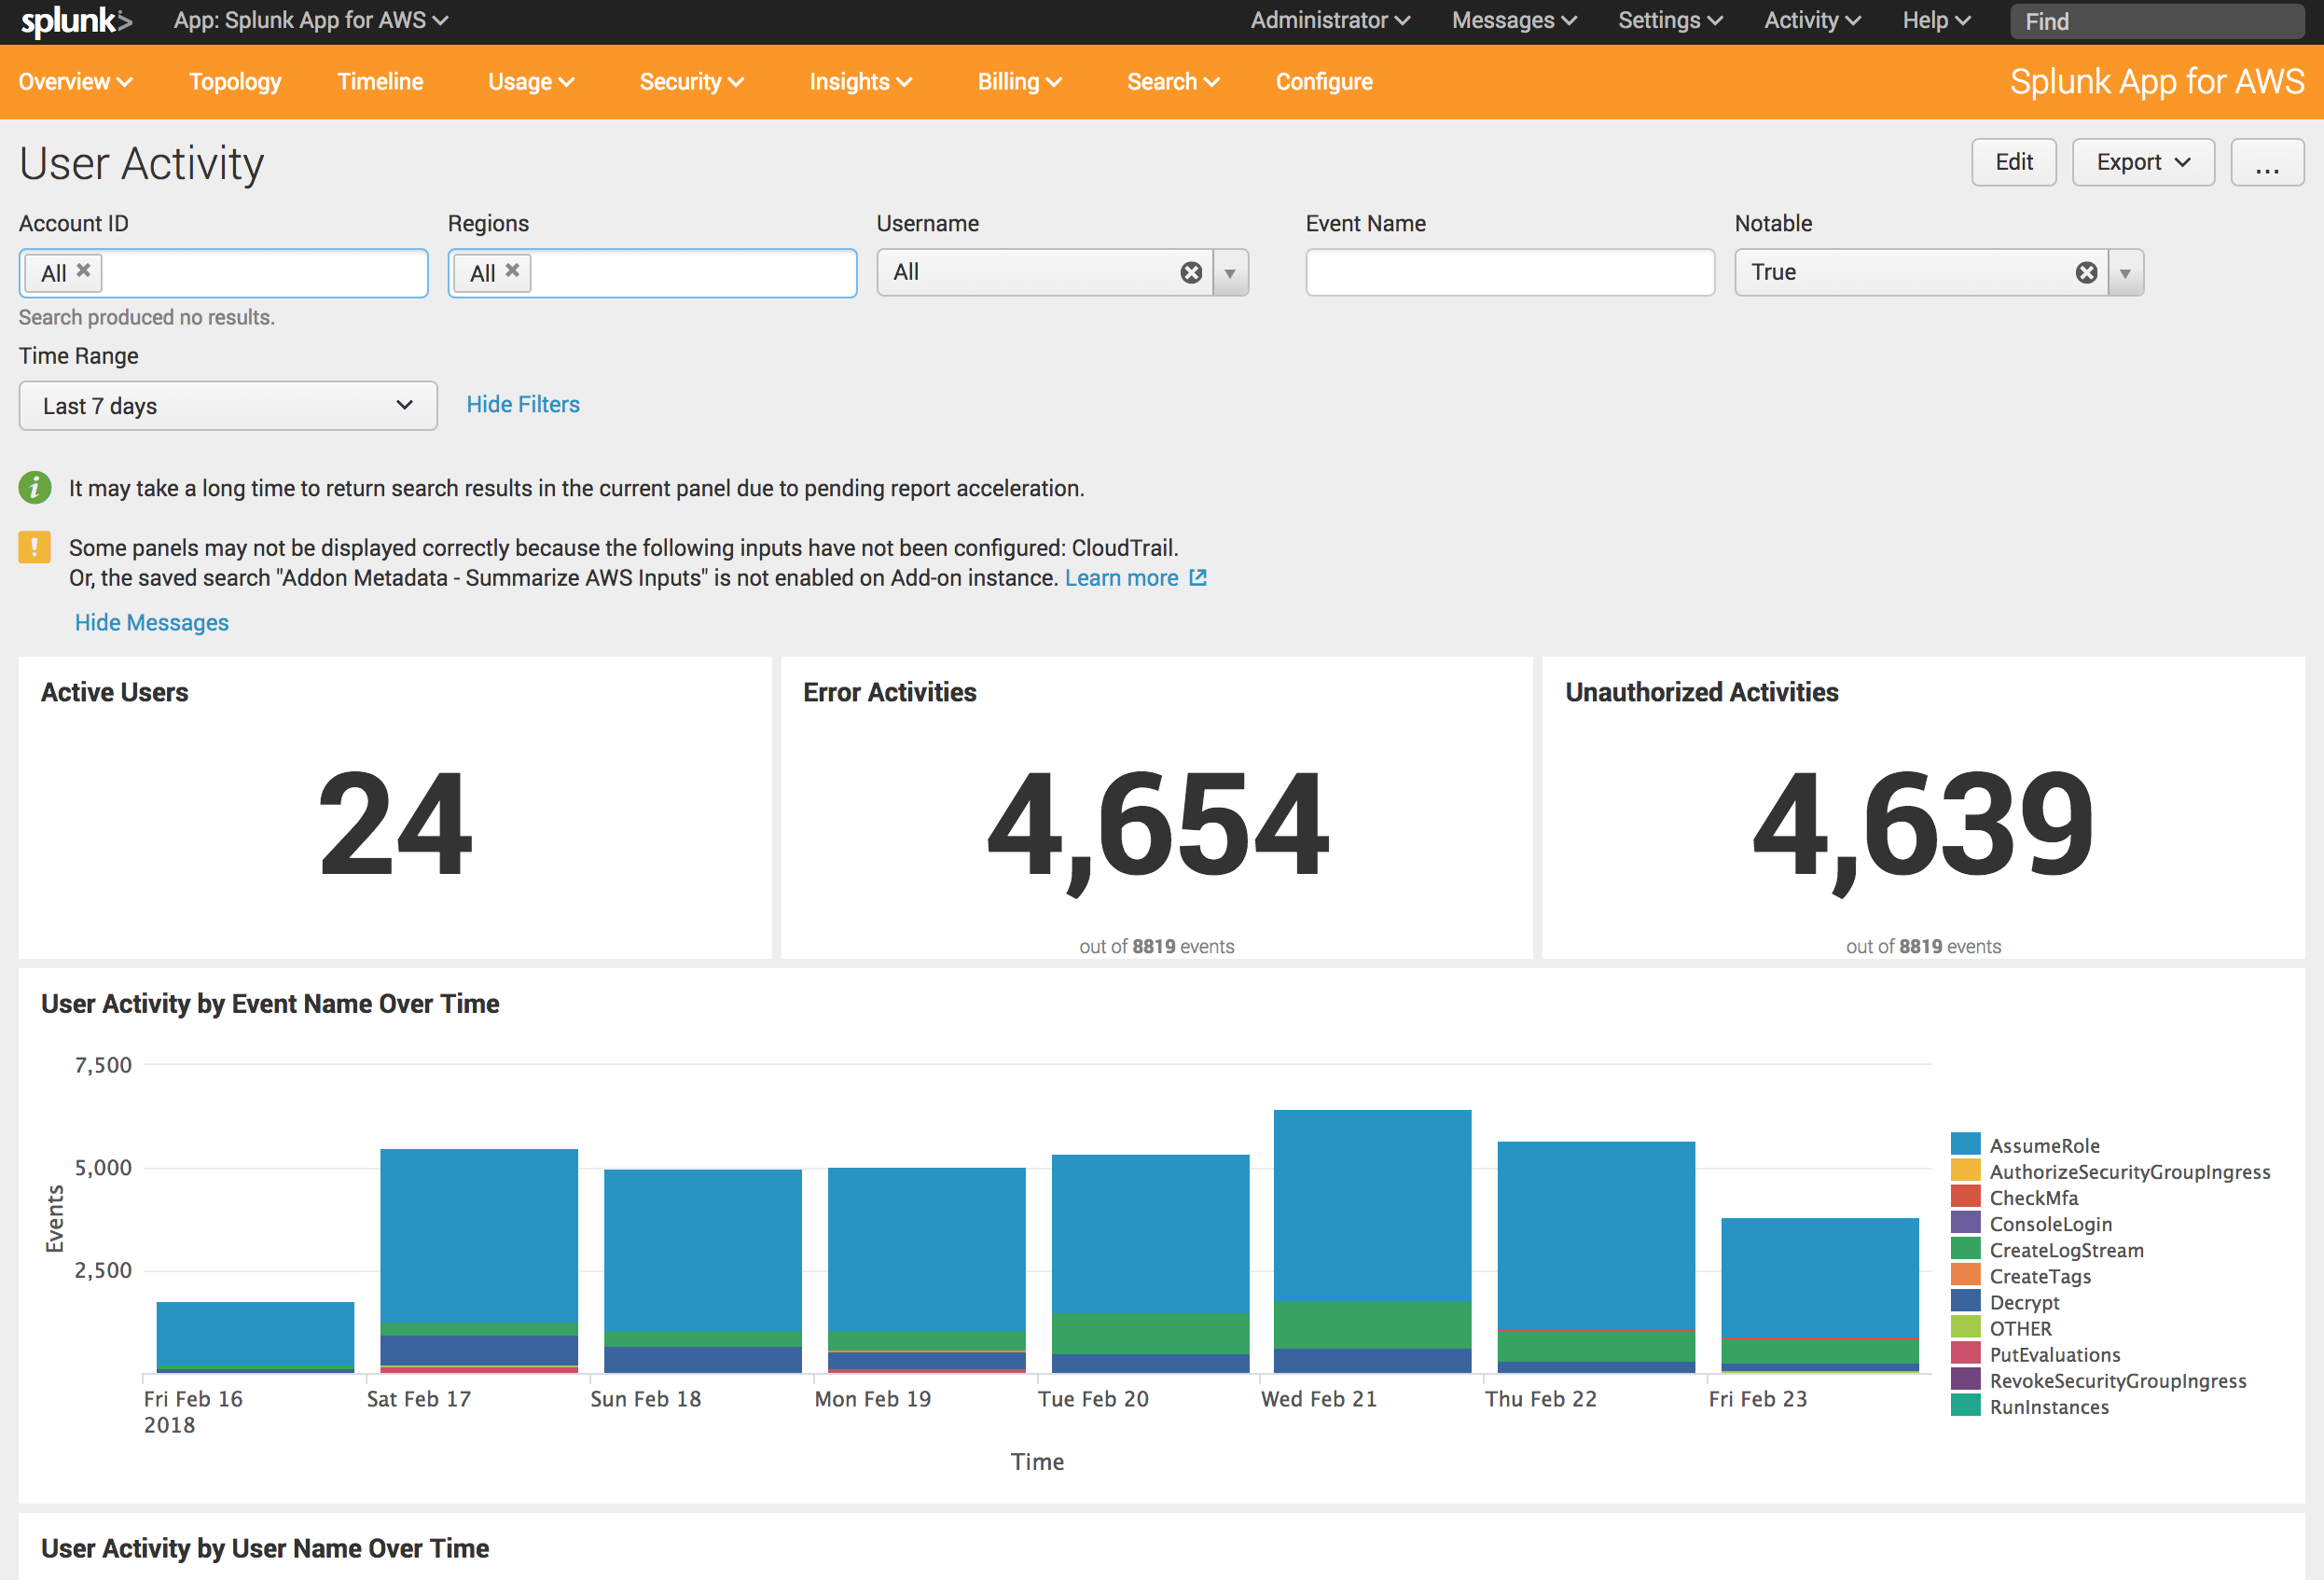
エラーや非認証のアクティビティが集計して可視化されてる!
非認証多いな、なんでだろう...
CloudTrailで 証跡情報を全てのリージョンに適用 にチェック入れてると、全リージョン情報が出てくるし、ダッシュボードでは自分が見たいリージョンだけをフィルタリングして表示することもできるみたい。
おわりに
この設定、AWS素人の自分にはなかなか難しかったです。
つまずいたポイントは、、、
- FirehoseからSplunkに送信する際に
"errorCode":"InvalidEncodingException","errorMessage":"The data could not be decoded as UTF-8"がS3に吐き出されていたものの、対処法がわからず右往左往 - 各サービスでIAMのロール設定が必要になるけど、どんな権限付与すればいいのかわからない(というより、ポリシーの設定方法がよくわかってなかった)
- FirehoseがLet's Encryptを認証してくれない
ってところですかね。
VPC Flow Logも同じようにCWLからFirehose経由でSplunkに送ることができます。
その際、Splunkに取り込む際のソースタイプがCloudTrailとは異なるので、HECトークンもCloudTrailとは別々に作る必要があります。
うまくいってなかなかの達成感でした。