グローバルマップ上に気象データをプロットしたいのになんか違う...
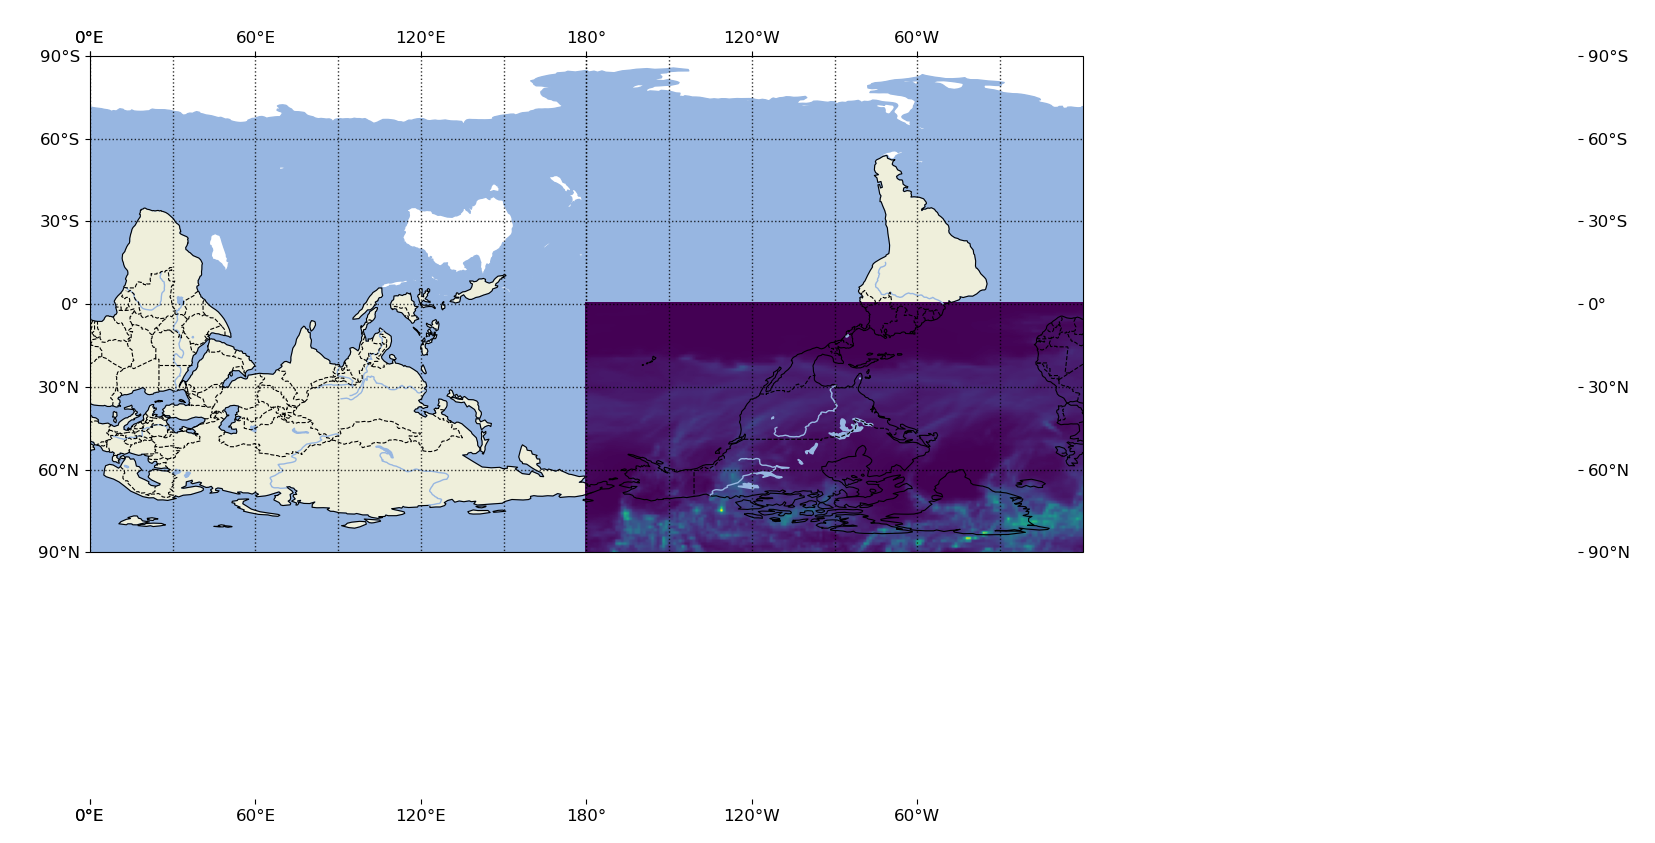
- 世界地図と降水データのサイズあべこべ...
- なぜか世界地図がさかさま...
- 横軸・縦軸があらぬ方向に...
とにかくcartopyで苦戦したので,その解決法を載せときます
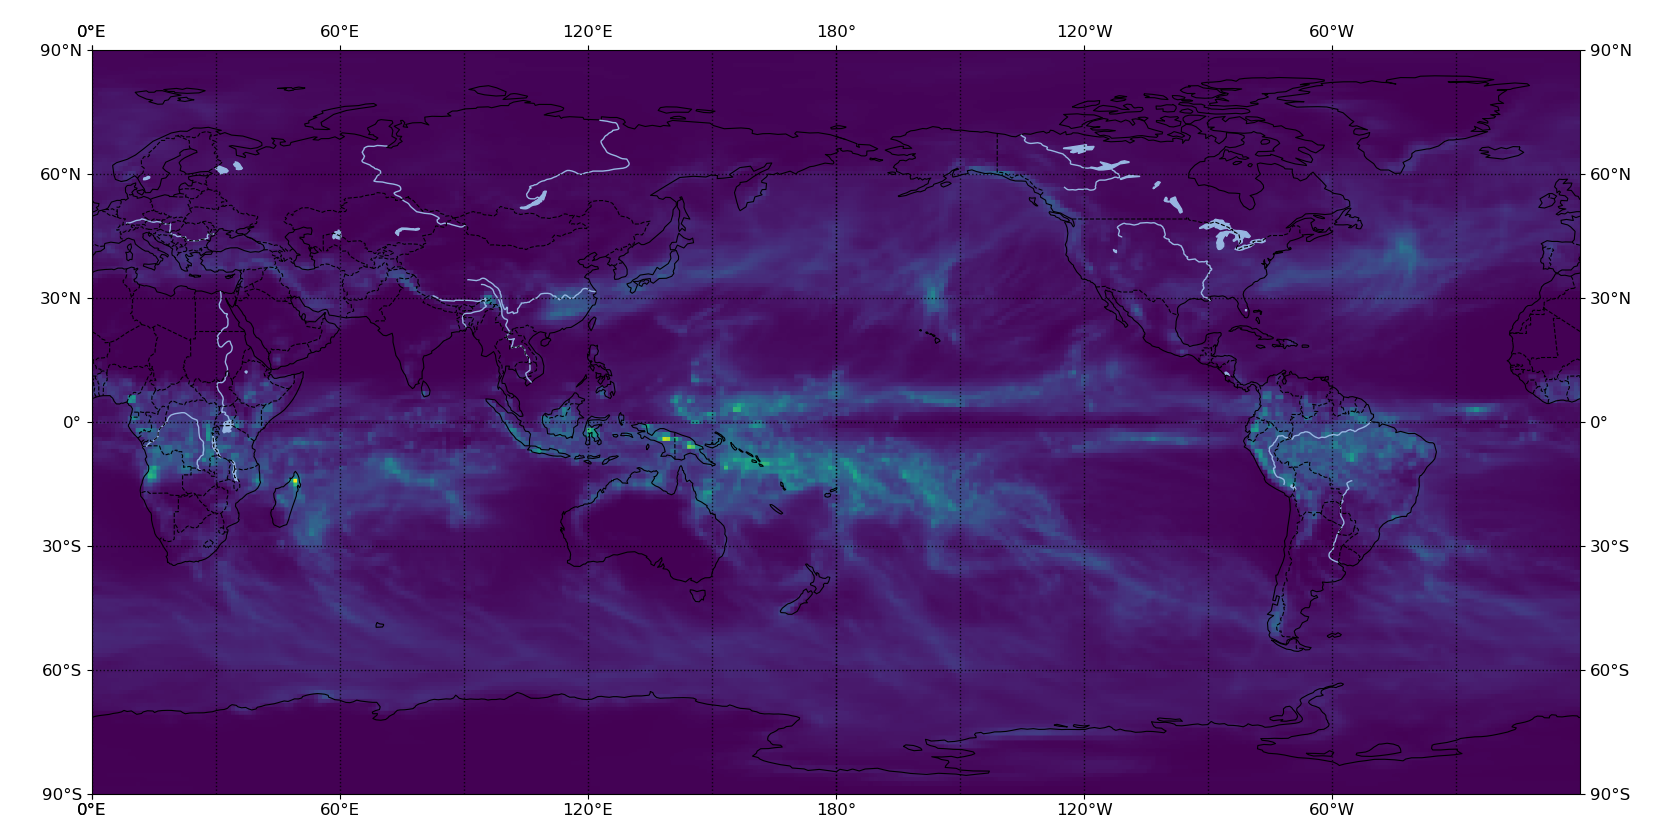
答えからいうと"plt.imshow(extent)"を使おう
お急ぎの方は,googleで'plt imshow extent'と検索すると幸せになれると思います.
from netCDF4 import Dataset
import matplotlib.pyplot as plt
import cartopy.crs as ccrs

# 降水データを読み込んでます.
ds = Dataset(path,'r').variables['prec'][0][0][0][:][:]

img_extent = (-180.5,180.5,-91.0,91.0)

fig = plt.figure(figsize=(10,10))
proj = ccrs.PlateCarree(central_longitude = 180)
ax = fig.add_subplot(1,1,1, projection=proj)
tp = ax.imshow(ds, origin='lower', extent=img_extent, transform=proj)
ax.set_global()
ax.coastlines()
plt.show()
ポイントになるのはplt.imshowのAPIに含まれるextentとoriginの機能.
extentはタプルを与えると(left,right,bottom,top)の順で表示する範囲を指定できる.
originは数値を'lower'か'upper'の2種類が選べ,数値をどちらから詰めるかを指定できる.
今回のデータはds.shape = [181,360]の形をもっていたので,試行錯誤的にimg_extentを調整してます.