環境
- macOS
- python3.6
やりたいこと
- 正規確率分布モデルを作るための練習がしたい
- irisのデータセットを使い、matplotlibで可視化しながら進める
使用ライブラリ
import pandas as pd
import numpy as np
from sklearn import datasets
import matplotlib.pyplot as plt
データセット
データセットの読み込み
iris = datasets.load_iris()
iris_data = pd.DataFrame(data=iris.data, columns=iris.feature_names)
データセットの概要確認
iris_data.info()

# 結果
"""
<class 'pandas.core.frame.DataFrame'>
RangeIndex: 150 entries, 0 to 149
Data columns (total 4 columns):
sepal length (cm)    150 non-null float64
sepal width (cm)     150 non-null float64
petal length (cm)    150 non-null float64
petal width (cm)     150 non-null float64
dtypes: float64(4)
memory usage: 4.8 KB
"""
正規確率分布のプロット
関数の定義
def normal_prob_plot(ser):
    """
    Check whether the data conforms to the normal distribution
    """
    y = ser.sort_values()
    n = len(ser.values)
    xs = np.random.normal(0, 1, n)
    x = pd.Series(np.sort(xs))
    return x,y

def linear_line(x,a,b):
    return a*x+b

def linear_line_sequence(ser,a,b):
    """
    ser: x axis sequence
    a : slope
    b : inter
    """
    linear_seq = [linear_line(x,a,b) for x in ser.values]
    return np.array(linear_seq)
データの統計量を事前に計算
mean = iris_data["sepal length (cm)"].mean()
std = iris_data["sepal length (cm)"].std()
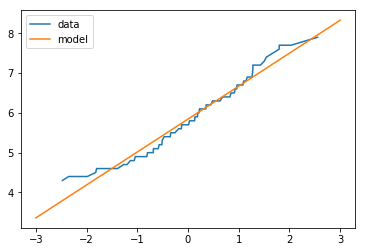
データとモデルのプロット
fig = plt.figure()
ax = plt.subplot(1,1,1)

x,y = normal_prob_plot(iris_data["sepal length (cm)"])
ax.plot(x,y,label="data")

x = np.linspace(-3,3,100)
y = linear_line_sequence(pd.Series(x),std,mean)

ax.plot(x,y,label="model")

plt.legend()
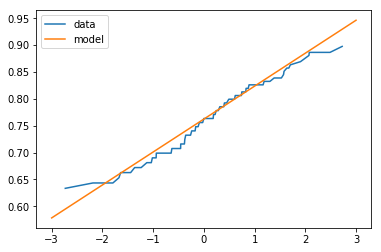
対数正規分布
データの統計量を事前計算
log_iris_data = np.log10(iris_data["sepal length (cm)"])
mean = log_iris_data.mean()
std = log_iris_data.std()
データとモデルのプロット
fig = plt.figure()
ax = plt.subplot(1,1,1)

x,y = normal_prob_plot(log_iris_data)
ax.plot(x,y,label="data")

x = np.linspace(-3,3,100)
y = linear_line_sequence(pd.Series(x),std,mean)

ax.plot(x,y,label="model")

plt.legend()
まとめ
- データセットによらず正規確率分布モデルの作成とそのプロットができるようになった
- 今回は対数正規確率分布モデルも作成したが通常のモデルからの改善はみられなかった
- そもそも正規確率分布モデルがこのデータに適しているかの検証は別途必要