導入
後輩氏「POCSって何ですか?」
後輩氏「圧縮センシングがやりたいです」
ワイ氏「ちょっと調べてみるわ」
ASD-POCSを書いてみた。
インポート
import numpy as np
import matplotlib.pyplot as plt
%matplotlib inline
シミュレーションデータ
from skimage.io import imread
from skimage import data_dir
from skimage.transform import downscale_local_mean, radon, iradon, iradon_sart
from skimage.measure import compare_psnr
N_view = 15
N_sart = 20
theta = np.linspace(0, 180, N_view, endpoint=False)
im = imread(data_dir+"/phantom.png", as_grey=True)
im = downscale_local_mean(im, (2, 2))
sng = radon(im, theta=theta, circle=True)
fbp = iradon(sng, theta=theta, circle=True)
sart = np.zeros_like(im)
for i in range(N_sart):
sart= iradon_sart(sng, image=sart, theta=theta)
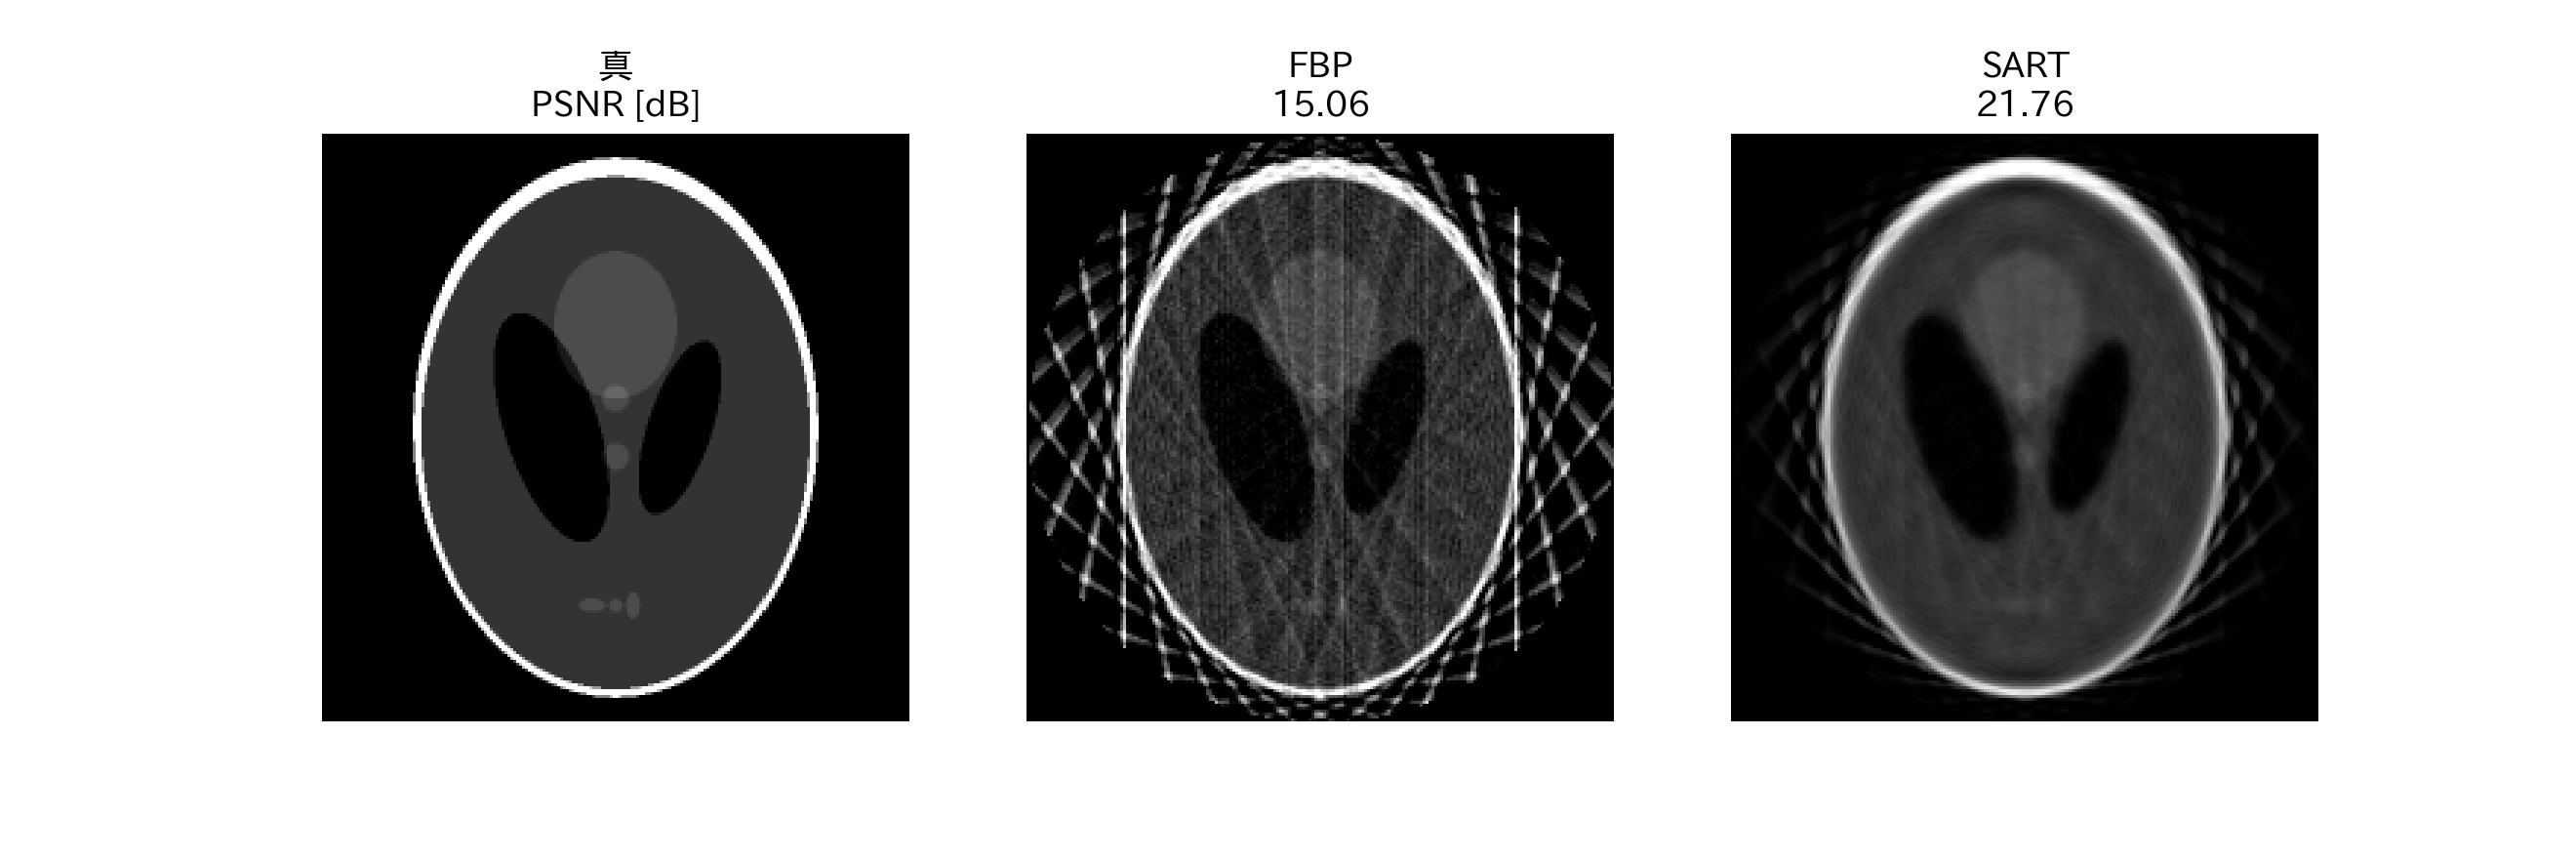
fig, ax = plt.subplots(1, 3, figsize=(12, 4))
ax[0].imshow(im, cmap='gray', vmin=0, vmax=1)
ax[1].imshow(fbp, cmap='gray', vmin=0, vmax=1)
ax[2].imshow(sart, cmap='gray', vmin=0, vmax=1)
ax[0].set_title('真\nPSNR [dB]')
ax[1].set_title('FBP\n{:.2f}'.format(compare_psnr(im, fbp)))
ax[2].set_title('SART\n{:.2f}'.format(compare_psnr(im, sart)))
for a in ax:
a.axis('off')
plt.savefig("result1.png", dpi=220)
TVの勾配
def gradTV(im, eps=1e-8):
    """ grad of TV """
    x_minus_1 = np.roll(im, 1, axis=1)
    x_minus_1_y_plus_1 = np.roll(x_minus_1, -1, axis=0)
    y_minus_1 = np.roll(im, 1, axis=0)
    x_plus_1_y_minus_1 = np.roll(y_minus_1, -1, axis=1)
    x_plus_1 = np.roll(im, -1, axis=1)
    y_plus_1 = np.roll(im, -1, axis=0)

    v = (im - x_minus_1) / np.sqrt((im - x_minus_1) ** 2 + (x_minus_1_y_plus_1 - x_minus_1) ** 2 + eps)
    v += (im - y_minus_1) / np.sqrt((x_plus_1_y_minus_1 - y_minus_1) ** 2 + (im - y_minus_1) ** 2 + eps)
    v -= (x_plus_1 + y_plus_1 - im * 2) / np.sqrt((x_plus_1 - im) ** 2 + (y_plus_1 - im) ** 2 + eps)

    return v
ASD-POCS
from skimage.measure import compare_psnr

N_iter = 1000
N_sart = 1

ng = 20
alpha = 0.2
r_max = 0.95
alpha_red = 0.95
eps = 0.

x = np.zeros_like(im)

for i in range(N_iter):
    x0 = x.copy()

    # SART
    for _ in range(N_sart):
        x = iradon_sart(sng, image=x, theta=theta)
    x *= x > 0
    x_res = x.copy()

    # Adaptive steppest descent of TV minimization
    b = radon(x, theta=theta, circle=True)
    dd = np.sqrt(np.sum((b - sng) ** 2))
    dp = np.sqrt(np.sum((x - x0) ** 2))

    if i == 0:
        dtvg = alpha * dp

    x0 = x.copy()

    for _ in range(ng):
        dx = gradTV(x)
        dx = dx / (np.sqrt(np.sum(dx ** 2)))
#         dx = dx / (np.sqrt(np.sum(dx ** 2)) + 1e-8)
        x = x - dtvg * dx

    dg = np.sqrt(np.sum((x - x0) ** 2))

    if (dg > r_max * dp) and (dd > eps):
        dtvg = dtvg * alpha_red

    if (i + 1) % 10 == 0:
        print(i + 1, compare_psnr(im, x_res), dtvg)

asd_pocs = x_res
結果
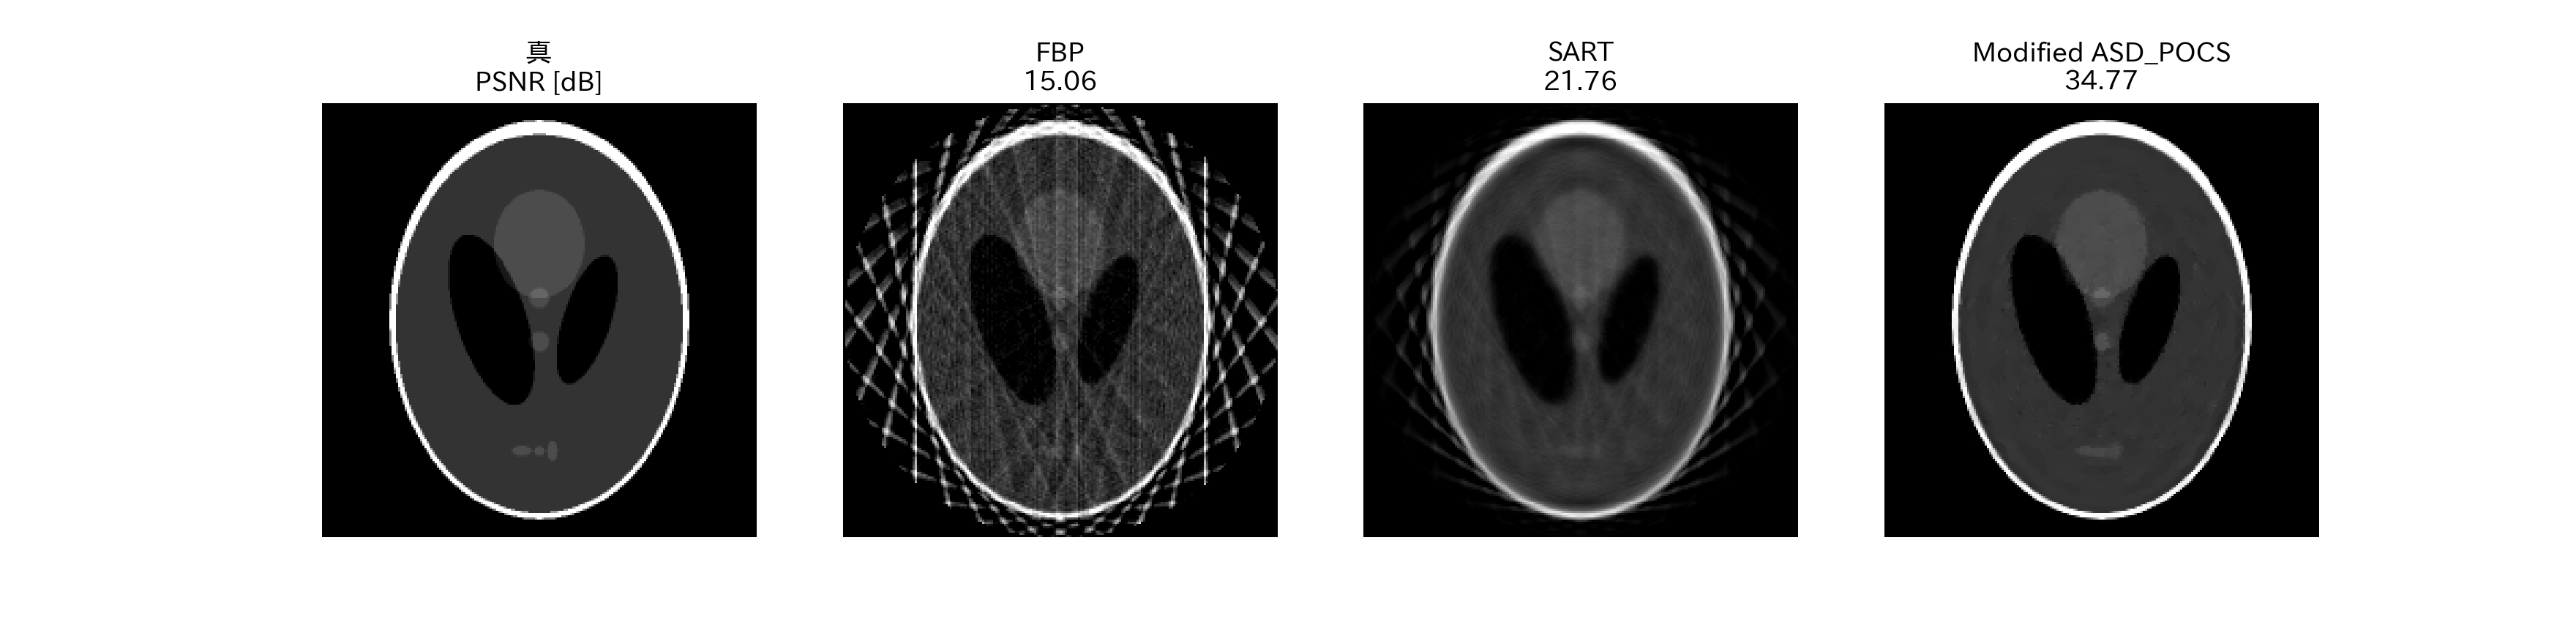
考察
- 元のASD-POCSはARTだが、書くのがめんどくさかったので、skimageのiradon_sartを使った
- ファントム下部の小さい3つのスポットは分解できていない
リンク
ASD-POCSのJupyter notebook
Radon transform -- skimage
Sidky EY, Pan X, Phys Med Biol 53: 4777-4807, 2008